Forex
Forex/Trading is a topic that's been done - redone - washed - repeated for a long time now. While I'd like to NOT reinvent the wheel - some of that will get done in this section. So let's get into it a bit.
Last Update: 2022-10-22.
To make things easier, use the index/contents below. If you want to go back to the top and find something else - hit the HOME key on your keyboard. You can also just use the search function of your browser.
Introduction
I'm a regular person that loves information technology (IT). I've been doing this for years. I got into trading when it was introduced to me by a client and friend. I saw it as a means of potentially getting out of the "hand to mouth" that most middle-class Jamaicans go through, and as a technical challenge to figure out something that operates on a global scale. What I've found is that it is possible to make money in forex - but it takes time and discipline. Time is the main thing I don't have due to work (IT obligations + "roasting") - but whenever I've had free time I've been able to make progress. I'd like to share the methods used publicly so that others can benefit from that information.
With that said - I think I've gone through enough to help others on their own trading path. What payment do I want for the information? None. Just use my affiliate links to sign up with the brokers or services I've listed - that's all I ask.
Why am I not rich out of forex yet? Long story. Let's make it short-ish.
- 2017 - Just heard about trading - tried services and tested brokers.
- 2018 - Learning how to trade. Having some success.
- 2019 - Best trades. Great success. Father passed away.
- 2020 - No trading due to mentality. COVID.
- 2021 - No trading. Started dabbling and re-learning.
- 2022 - Working out the kinks, but actually started back.
That's where it is now. I've given myself until the end of 2023 to get things going. If I can't be very profitable out of trading - I'll put it down at that point and focus on IT solely. The information will remain and will always be free. I do believe that the things I'll show here can help you on your own trading journey - but until I am able to invest the time fully - I won't be able to do more than break even. My work schedule is that hectic.
DISCLAIMER
Do not take any information here as financial advice. Blah. Blah. Blah. Etc. Etc. Etc. If you're here then you want to find out some info - and I'll give it. It's not to be considered as a "holy grail" or anything like that. It's just my point of view on the whole financial market system and how to make money from it.
I'm going to be blunt in some areas and more detailed in others. I apologize in advance.
Jamaica Forex Banking Update – 2021-05-18 and 2022-10-01
As of the first date above - it came to my attention that BNS / Scotiabank Jamaica is no longer allowing transactions to or from Forex brokers. They are explicitly blocking transactions done – tested and confirmed after finding out.
JN credit cards and NCB debit cards are confirmed working. Uncertain if BNS credit cards will work.
Tested in October of 2022. JN Visa Credit Cards no longer work for broker deposits. Uncertain if Sagicor works, but confirmed that both credit and debit cards from NCB are functional.
Wire transfers TO your local account will not have any restrictions.
While it’s known that Forex has gotten more difficult to partake in, this comes as a bit of a shock to me.
This will be updated as I receive more data. There are other banks, but I don’t have accounts everywhere so I can’t test them all. Once I get more confirmed details I’ll update this post or create a new one with full details.
What Is ForEx?
Here's the TLDR.
- Forex is putting a dollar value to the rise/fall of currency pairs.
- Forex isn't for everyone.
- Some of the details here reinvents the wheel.
- Go to BabyPips and study - and watch the videos in the YouTube link.
Links
Here's the links.
cTrader Forex Info - https://www.youtube.com/watch?v=PKkNjY2oorU
BabyPips Course - https://www.babypips.com/learn/forex
HotForex Webinars - https://www.youtube.com/user/HotForexBroker/videos
OANDA Forex Market Hours - https://www.oanda.com/forex-trading/analysis/market-hours
OANDA Currency Strength - https://www.oanda.com/forex-trading/analysis/currency-heatmap
Investing.com Economic Calendar - https://www.investing.com/economic-calendar/
FXStreet Economic Calendar - https://www.fxstreet.com/economic-calendar
MyFXBook Economic Calendar - https://www.myfxbook.com/forex-economic-calendar
ForexFactory - https://www.forexfactory.com/
Forexlive - http://www.forexlive.com/
Longer Version
Information about Forex can be found on INVESTOPEDIA. A very good site for quite a lot of info. I’ve butchered the information that I recall from my own research and added it here. For something more comprehensive please see the linked articles.
https://www.investopedia.com/articles/forex/11/why-trade-forex.asp
https://www.investopedia.com/terms/b/brettonwoodsagreement.asp
The term FOR EX is a shortened form of Foreign Exchange. If you’ve been to a bank or other place and traded in your home currency for some other currency that’s Forex. If you’ve received money from overseas that was in another currency, and it had to be converted to your home currency – that’s Forex.
Forex is simply the exchange of currencies.
Forex History
Goods Trading
In the past – long ago – people would exchange goods for goods. Carrots for potatoes. Sheep for cows. That kind of thing. Don’t quote me on that kind of exchange though – I’m just giving examples. But goods would spoil over time and would be costly to transport. So humans started placing value on shells and stones. Eventually we got to precious stones and gems – like gold and such – and moved to coins then paper. Coins were easier to carry around and it was easier to do business, but in every age you have persons that want to capitalize on the naivety of others – and both coins and paper were counterfeited. Nowadays there are methods in place to reduce counterfeiting, but humans will be humans.
The Gold Standard
Gold was considered a precious metal that had value. Each country then tied their currency to gold. The USD (United States Dollar) was equivalent to gold by (for example) $1 = 1 ounce of gold. The USD was mostly stable, so the other currencies of the world would use the USD as a base to determine what their dollar/currency was valued at. Faster than measuring gold and doing the checks that way. After the Bretton Woods meeting/agreement in 1944, the gold standard was decided upon. This had persons from 44 countries agreeing on using the gold standard – the USD was pegged to a certain amount of gold and the others would value themselves based on the USD. In 1971 the president of the US (Richard Nixon) announced that they would no longer tie the USD to gold. This then gave rise to a floating exchange rate.
Floating Exchange Rate
Currently most countries are still valuing their currency based on the value to the USD. The difference is that the strength or weakness is based on resources, goods or services that are provided between those countries.
Not For Profit – Sort Of
An example of goods and services – and the currency strength – would be Japan. While China makes a lot of stuff, Japan has a far more friendly relationship with most countries. The Japanese Yen (the Japanese “dollar” – their currency – called the YEN – JPY) has been mostly stable versus the USD for an extended period of time. How can the country that provides electronics and vehicles not have a 1:1 ratio (one-to-one) with another country? Well. Because they want to.
If it became more expensive to do business with Japan, countries would take their business elsewhere. There are established and agreed costs for production of goods and services, and this has caused the Japanese bank (“Bank of Japan” I believe) to monitor the floating exchange rate markets and purposely keep their currency at a certain level versus the USD. So if the JPY is gaining ground on the USD – the bank starts doing things to manipulate the market and keep the rate as stable as possible. No major fluctuations are allowed as it would be very bad for business.
Trading For Profit
We’re not interested in keeping things stable. We’re retail traders. We’re interested in making money off the currency fluctuations. This can be done daily, weekly, monthly yearly and a niche can be found to suit any need. If you’re a long term, short term or medium term trader – something is there for you.
Retail Trading
Persons that are not a bank, hedge fund, large business or otherwise directly involved in the daily market movements are referred to as RETAIL TRADERS. These are persons that speculate on the market and attempt to predict the direction.
Brokers and Leverage
In the past you had to trade from a physical location – call into your broker and set your orders. Now, everything is done electronically using software platforms that link to the brokers.
There are now literally hundreds if not thousands of brokers available to choose from. Each provides you with an option for leverage. Trading requires a lot of money, but leverage helps with that. Leverage can work for and against you – as it increases your earning and your losing potential. The broker also may provide different types of accounts so that you can start with a small balance. A “cent” or “micro” account for example would allow you to trade with as little as USD$10 versus other accounts. Standard accounts with leverage have recommended minimums of USD$300-$500 and accounts with zero leverage would require a minimum of USD$10,000 if I’m not mistaken.
Section Closing
With those things in mind, let’s move on to the more exciting part. Actually setting up and trading. And how to do it and make some profit. If you find that you’re unable to profit on the demo account – don’t move to live. Work on the demo until you’re able to make profits.
Getting Into It
There is no "holy grail". Finding what works for you - what resonates with you - will take time and patience. The easy way out is to copy a successful trader - but there are caveats to that. For the full details - continue reading on.
START (edited)
I'd like to share some stuff which I hope will advise and assist the newer traders in here. Maybe help to bolster things on the seasoned traders as well. Let's start with this - or the same info that's above at the top of the thread.
My trade explorer was removed (by me) due to the changes to my account.
I'll post information regarding previous account details here. s
HOW TO TRADE
Everyone probably gets lured into trading thinking it's a fast way to make money. It is and it isn't. It takes time to learn - either how to trade or to learn a system. It takes even longer if you have to make your own system.
MY JOURNEY
So let's try and make a summary. I've said it before (above).
- 2017 - Just heard about trading - tried services and tested brokers.
- 2018 - Learning how to trade. Having some success.
- 2019 - Best trades. Great success. Father passed away.
- 2020 - No trading due to mentality. COVID.
- 2021 - No trading. Started dabbling and re-learning.
- 2022 - Working out the kinks, but actually started back.
I did a few things during the learning phase. I lost a lot. I felt invincible at points. Let's see...I lost most of an account right down to $14. Took that back to $80+ and then lost it. I work in a specialized IT industry - office sent me on training so I had no work to do. During that training period I took a $100 account to $1,100+ and then lost it all. That one I can explain. But there's a pattern here. I always make great gains then lose. And I identified two reasons.
- Over-leveraging.
- Emotions.
Every time that I make good gains - I deviate from the original plan and then lose. Do I lose because my analysis is wrong? No. Price almost always goes where I expected when I check back. I say almost always because I'm not perfect. That covers the over-leveraging.
Emotions lead to over-leveraging as well. My father got sick and passed away. During that time I had pushed my account up to from $100 to $1,100+ and was doing mostly fine - but as he deteriorated I got desperate. I heavily over-leveraged because I wanted that fast money to get things done. It didn't work out.
In the end - can you over-leverage and make it? Yes. But your account will not be able to withstand any large drawdown if you do. So I don't recommend it.
MENTORS & COMMUNITY
This was a major block for me. I've always been looking for some successful trader to teach me their way. I joined here and other communities looking for the "holy grail" - some sort of strategy that just works and gives me little to do other than follow some rules or something. Then I started looking into EAs. Nothing worked. Everyone has an opinion. Everyone knows best looking on from the outside. There's so much going on.
A SOLUTION?
So with everything going on - how do you find a solution? How do you enter this "forex thing" and actually succeed? Well. The answers will be hard - but let's try and be honest about it. From here - will just be things I've found and wish I had a mentor for. Hopefully those who come across this - or persons I forward it to - will get something out of it.
MAKE A PLAN
Now this doesn't mean you've got to make your own system. This means set out a plan. What do you get ed in interviews from time to time? "Where do you see yourself in 3-5 years?" You should ask yourself a similar thing for trading. Forex, stocks or crypto - any kind of trading - it doesn't matter. Set a goal of a certain number of years. After that timeframe is passed - if you do not see progress or are not profitable - get out. Trading can be addictive - even with losses. GET. OUT. Let me give a basic plan.
- 3-6 months to learn.
- 3-6 months testing - demo or small live account.
- Within the above time you perfect your strategy.
- 2-3 years trading on live.
If after the planned period you have no good results - or you're not seeing a way out - GET. OUT. STOP.
It's unfortunate, but not everyone is cut out for trading. Whatever your reason - your day job or psychology for example - something may be preventing you from gaining pips in the market. If you find that it's not for you - get out. Don't stay and waste money over months/years. Give it a good go and if you fail - at least you tried.
TRADING SYSTEMS
Now to be honest - I don't want to bash any specific system. But the easiest one for me to find that I disagree with is the lunar cycle trading. I mean - it does work for those who use it - but I don't see exactly how...
I've never tried that system - and there are LOTS that I haven't tried. There may be hundreds if not thousands of systems out there, and with so many to choose from there are pros and cons. The pros would include having options. With the wide array there should be at least one that resonates with your character, preference and trading style.
The cons would include being unable to find one. Even with reviews done her and on FXPA - the statement "results not typical" applies. Whether it's account size or settings - you may not get the same results.
There's also the fact that a system may not suit your style. Let me give two examples.
If you're a long term trader and you buy or find a system that's short term - it may annoy you with all of the getting in and out of trades daily/weekly. The constant stream of wins/losses may get to you. If you're a short term trader then watching a position go in drawdown for days or weeks may weigh on you and you close out in loss while others end up closing in profit.
You need to find what works for you.
BOOKS & SUCH
Now I've purchased a lot of stuff during my own journey. Some of the books are really good. "Trading In The Zone" is a great book for getting your psychology sorted. "Naked Forex" is another great book that helps you learn price action. And for short books that are a few by "Laurentiu Damir" that I find to be good.
MY PERSONAL APPROACH
Unfortunately, due to my nature of taking things apart - I need to understand what the thing is and how it works. As a result, my approach to trading has been trying to at least grab a basic understanding of the indicators and how things work before I use them. It's been said over and over that price action is the greatest tool, coupled with "the trend is your friend". If you find that a fully indicator based trading style is more your thing - then ensure you test it before you get into it.
COPY TRADES, EAs & AUTOMATED TRADING
Now for some things that may have mixed results. If you don't have the time to trade, you can always get a copier service or some automated trading service - EA or otherwise.
For copier services, there is no way to know that what you're being sold is fully true. If you want to copy someone or something that's successful, use the services available on MQL or FXBook. I don't know of FF having a copy service available or else I'd recommend that. Find a trader that has good stats that you're comfortable with - pay the commission and leave it alone.
For copier services that are advertised otherwise - they may be running from certain regulations or fees from using other platforms. If you have a good set of stats from them that are verified on a platform such as here or FXBook - use at your own risk. I mean - if it's verified information then it should be less risk, but everyone has different results.
For automated trading and EAs now...that's a tricky one. I've often thought that I'd love an EA based on my strategy and style, but I don't have the skills to code that. I also don't want to have someone make it and potentially steal my idea and sell it. There are some automated services like those from "Dennis Buchholz" that are updated frequently - those I trust a bit more, but still will have mixed results based on settings and account size. Dennis updates his EAs frequently enough to match the changing market conditions - and to update the overall coding.
Oh - the mention of names, books and such aren't an endorsement or recommendation - I'm just giving examples of things I've used or seen.
I don't trust back testing either. Most professionally coded EAs are actually designed to run great during back-tests because the past data is already known. That's why you'll have great back-test results and poor live results. Some EAs also do great under certain market conditions and crash in others. So there are no EAs that I've seen personally that are "set and forget". You have to periodically check on it and see what's happening. It somewhat defeats the purpose of passive earning when you have to be checking on the EA.
If you find one that works for you - stick with it. For things you're using like an EA - use the recommended settings. For copy services where you have any control over lot sizing - stay within your means.
MENTORING MENTION (AGAIN)
I'm coming back to this to mention someone. Mr. Lee Starks aka "Uncle Lee". He's been written off by a number of people and I don't actually understand why. Prior to having a few paid services - like 4 or 5 things including one copy service - he has been on Telegram in numerous groups helping persons streamline their trading. Even during his paid services and even now, he's been trying to help persons on his own time and at zero cost. He's tested and paid for a number of different things and has given away information freely. But people have had mixed results and as such, he's been written off by a lot of persons. What this says is, you can find persons that have the best intentions that are still spoken poorly of. It also comes back to the trading styles and systems. From the screenshots and stats that he's shared, he's doing fine. Do all of his followers have great result? Nope. Does that mean his system doesn't work? It may not work for YOU specifically, but it may work for someone else.
A BASIC SYSTEM
Here's one of the most basic systems I can think of. And is the basis of what I do. Use a couple MAs and RSI. If you want to find and purchase TDI you can do so - there are also free TDI versions available online.
Disclaimer that this is basically a strategy used for scalping. The principle can be applied to longer term trades though.
Open a chart with a 50 EMA and 200 EMA. Switch between the 15 minute, 1 hour and 4 hour chart. Note that the lower MA is basically equal to the higher MA on smaller timeframes. That's to say - the 200 EMA on the H1 is the same as the 50 EMA on the H4. With a certain cluster of MAs you can tell where price is on a higher timeframe without switching to it.
Look for price action, candle formations, patterns or support/resistance levels. Let's say you have an engulfing candle on the low or a double bottom formation. You get that on the H4, D1, W1 or MN timeframe. You drill down to the lower timeframe and trade long (buys) until price has reached another level or MA before you get out. Do your confirmation of a break/trend/move on the higher timeframe - enter on the smaller timeframe.
Something else would simply be...identify the trend. Is price going up or down? OK. Did it bounce off an MA or a level? Enter on the next bounce.
I mean - you could complicate it more by using fibs and QT and such - but that's just to keep it simple. And you can actually win with something like that. There was another very simple strategy which I saw....
Use Heikin Ashi candles on the D1 with a 20 SMA. If price is below the SMA - prepare to sell. If it's above the SMA - prepare to buy. You'll confirm your buy/sell entry if the Heikin Ashi candle is red or green. Red and below the SMA is a sell. Green and above the SMA is a buy. Then you'll switch to another type of chart and use other confluences for your entry. You can't get much more simple than that. Unless you're going to do a simple MA cross.
STATISTICS
Another thing I was obsessed over in the past was stats. I actually had an account where I had zero losses for 3 weeks straight. Decided to stick it out and do that - but it takes a toll when you have a job other than trading.
Stats are nice to look at - but in the end you really want to look at 2 or 3 things.
- Pips.
- Percentage.
- Balance.
Where pips are concerned, it actually is possible to have a negative amount of pips and a positive percentage or balance. Imagine having a 30 pip (300 tick) win with a 0.30 lot size - about $300 win - and then have a 1,000 pip loss (10,000 ticks) with 0.01 - that's about $100. You're ahead with percentage and have increased your balance - but your pips are in negative by -700.
At the end of the day - ensure you're ahead. Do what is needed for you to push forward.
MENTALITY
Yes - you can make 100% or even 1,000% profit in trading after 1 week or 1 month. But that's very high risk unless you have a large enough account.
1% of $50 is $0.50.
1% of $500 is $5.
1% of $10,000 is $100.
If you can grow your account CONSISTENTLY by a small percentage each month for 3-6 months - you're well on your way to making money in trading.
Get in with a demo account to LEARN about the market - develop a strategy or adopt one - use this strategy for a minimum of 3-6 months to see how it works for you. Once you're comfortable with the strategy - move to a live account. Some brokers offer "cent accounts" where you earn very little, but it's actual market conditions. Some demo accounts are not subject to gaps, spikes and other movements in actual market conditions. A real account as well - regardless of how small - affects your psychology differently. Trade that small account for another 3-6 months and grow it consistently successfully. I've attached an Excel file where you start with $50. At the end of one year you should have over $600 - and that's at 1% per day.
Based on how this is - the file will probably be at the bottom of the post. It's called "1YEAR CI Calculator.xlsx" - it's an Excel document to help you project your profits once you have a system in place.
If you don't make your 1% per day - it's fine. If you make more - you're ahead and can take it easier. Do what you're doing consistently for 3-6 months to solidify the method you're using. Once you've done so, you can add more to your account and keep with the strategy.
Note that with a small account you can't open anything smaller than 0.01. The risk is higher with a small account. Your calculation of the lots to open - based on your strategy - should be around 0.01 for every $100 you have. You can scale upward from there.
If you want to take risks with certain types of over-leveraging on a small account, you're free to do so. Just bear in mind the risks. It's better to have consistent performance than to take large risks and lose.
For the persons that have looked at the account - yes I did heavily over-leverage at certain points based on the account size. I wouldn't have grown it so quickly otherwise. As the account grows however, the risks should go down. One of the things I've done - and I do not recommend this or put it here as advice - is to take a larger size position - like 0.10 for example - and then close it after it goes in profit by say....+$5 or $10. I do a partial close at this point of 0.08 or 0.09 and leave the remaining position of 0.01 or 0.02 to keep running. This is only done on entries that I can either sit and watch or those that match my entry rules by 85% or higher. This reduces the overall risk and gives me a boost to the profits and percentage. It increases my drawdown however, but that's inevitable with a small account.
Once you get your account larger - stick to the rules you have and the estimate of 0.01 lot to every $100 in your account. Meaning you can take a maximum of 0.10 for a $1,000 account and 1.00 for a $10,000 account.
BROKERS
There's a LOT of brokers out there. I won't bash any specific ones, but I'll say this - there are some that I'd avoid and never do business with again. I will only make mention of one particular broker - TradersWay. My personal experience with them was very poor. VERY. I'll post a chart. You can check back with your own broker and see.
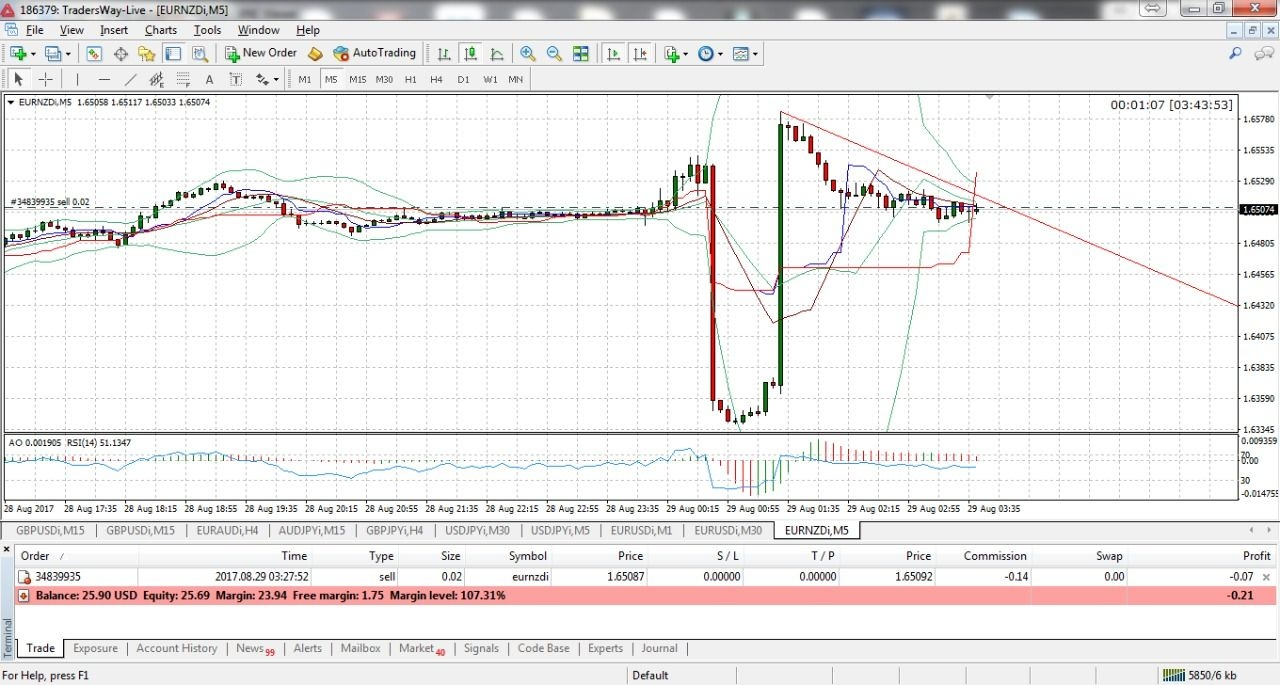
That was during my initial entry to trading. I had accounts at 4 different brokers and TW was the only one that had this kind of movement. Many people - and I mean MANY - have told me nothing but good things about TW, but this experience with them has made me leave and never look back.
Find a broker that works for you. I would personally only recommend two. If admins/rules will allow me to post my referral links to those two I will - but you can look them up yourself either way. HotForex and IC Markets. Great experience with them.
For challenges and to make some money with your skills - if you have limited resources - you can try the FTMO challenges or any other broker challenge that's available.
THE $50 ACCOUNT
I live in Jamaica - a little third world country in the Caribbean. People know the country for reggae, weed and Usain Bolt. I think that about sums it up. We also have some of the best coffee in the world - arguably. But being a third world country means not everyone has easy access to funds. My job allows me to open a $500 or higher account with relative ease - even if some sacrificing is needed to do so - but the average person cannot find $100 to open an account without taking a loan. After 2-3 months they can possibly save enough spare cash to do $50, but it's a major gamble for residents to find foreign currency.
The current rate for USD$1 is about JMD$157 - that means USD$50 is about JMD$7,850. Then there's getting it to the bank to do the broker deposit. Then there's the fees. Then there's the fact that many Jamaican banks have blocked transactions with brokers - so you can use wire transfers but that's an additional cost.
I'm doing this account to show that it is possible to start small and build up. Your account balance doesn't really matter. Sticking to your rules makes the difference. Managing your risk.
IN CLOSING
Find or develop what works for you. Go at a pace you're comfortable with. Exercise patience - that's one of the HARDEST things. Waiting on your ideal setups can be a pain, but once you find them - awesome. Keep practicing if you're sticking it out. Get out if you've been at it too long and aren't getting anywhere.
Don't mind your account size. Let people laugh at you. Ask them how many pips they made - or what percentage. That's what matters. I could never attempt to compare my $50 account with someone that has a $100,000 account. Not just because of the percentage difference due to the sizes - but the psychology of trading the larger account will be much different. The person with the larger account may reach their target balance before me - hence they do the other hard thing to do in trading - stop. They get to their target and then stop for the day/week. So they could have gotten more pips - but they're not taking any unnecessary risks.
Find your rhythm. Find your path. Make the decision to stay or leave. If you decide to stay - I wish you well.
GETTING STARTED
So let’s get started with learning how to trade. First off you need to have a platform. We’re going to jump ahead a bit and dive right into the setup, but normally you have to go through the whole signup with a broker first.
Every broker has to fill out KYC (Know Your Customer) documentation – much like a bank. You need to provide them with your name, valid ID and proof of address. Once your details are validated you can deposit cash to your trading account and get going.
Before doing any of that however, let’s get you set up on a platform and into a demo account.
Playing Games
So now. Welcome to Forex. Or the journey of learning about it and how to actually get things done. I assume you’ve read the disclaimer and we can proceed. If you have ZERO knowledge about trading then the first thing I’m sending you off to do is play a game.
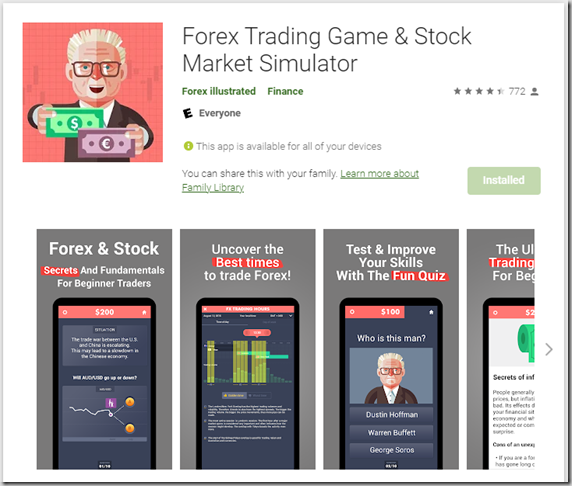
Their official website is: https://forexhero.eu/
You can download the iOS version from: https://itunes.apple.com/us/app/forex-hero-trading-game-for/id1011097561
Android Version: https://play.google.com/store/apps/details?id=lv.fitstergroup.forexhero&hl=en&gl=US
Playing through that will give you a quick basic idea of what Forex is and how to decide on taking trades. I found it to be really good and really cool. If you’d rather reading then continue on. Again – ensure you’ve read the disclaimer and if you see something that’s incorrect, please feel free to contact me and I’ll have it fixed.
The Trading Platform
As I think I mentioned before – there are a LOT of different platforms. The ones I can remember currently are:
- MT4 (MetaTrader 4)
- MT5 (MetaTrader 5)
- C-Trader
- NinjaTrader
- TradingView [this is web based]
- WebTrader (also known as eToro) [this is web based]
- ProTrader
Each platform has pros and cons – the less popular ones are only supported by some brokers, while the web based ones need to have platform support for the broker you choose. I believe the top ones are…..in no particular order:
- MT4 (Possibly #1 desktop platform)
- MT5
- cTrader
- TradingView (Possibly #1 web based platform)
MT4
I think that MT4 is the most popular platform. The major drawbacks would be:
- No native Mac OS support.
- Old platform – the creators want to push MT5.
- Resource intensive on older systems.
The pluses for the platform include:
- Established community.
- Due to above – lots of plugins/indicators/EA’s available (add-ons).
- Most popular – so used by EVERY broker.
With those in mind, let’s go ahead and install MT4. We’ll be covering the desktop installation only. If you want it on your phone/tablet/etc then locate the app within your respective app store and download. Again – remember that this is only available on Windows. You can emulate the platform if you like, but support may be limited if you do.
Setting Up MT4
Here's a video showing MT4 setup. You can review that or follow the text instructions. You may also skip to the next section.
MT4 Setup Video - https://www.youtube.com/watch?v=bXqjEbr6sqI
Some brokers require that you sign up with them before getting the MT4 setup file. Once you locate the link with your broker – download the file. This will usually be in your DOWNLOADS folder. Locate it and run it.
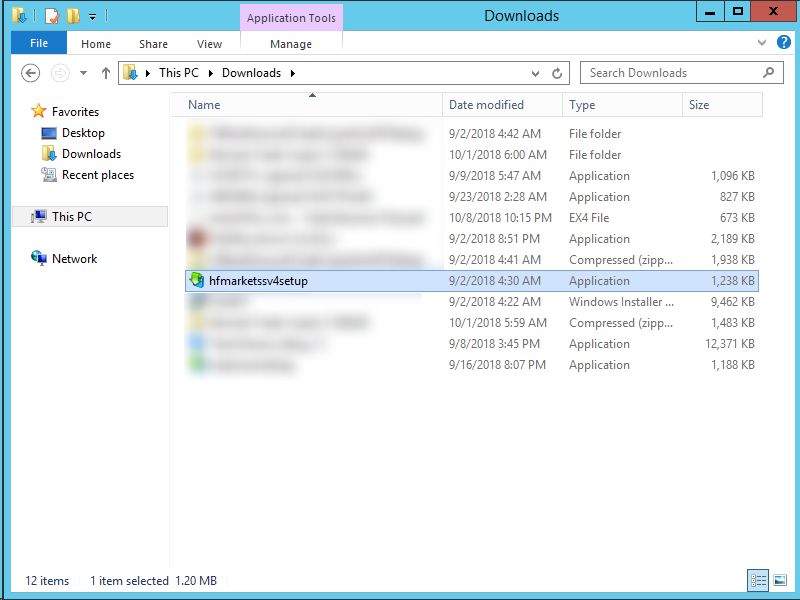
Once it’s run you really only need to click NEXT until it’s finished. If you get a UAC prompt then you may need to click YES when it pops up.
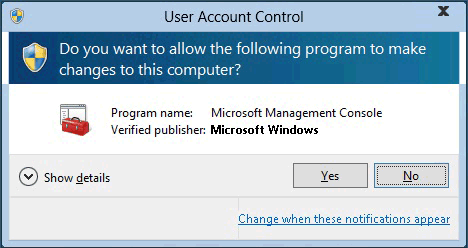
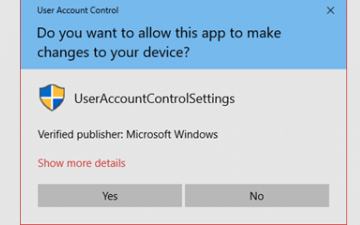
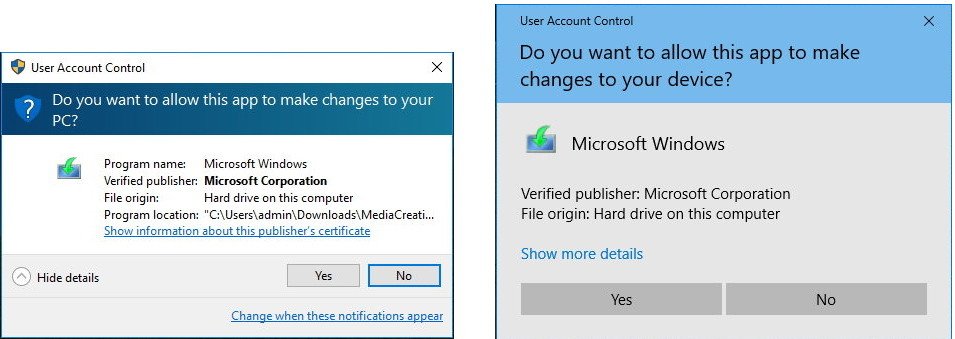
The UAC prompt will look similar to the examples seen above. If you got a UAC prompt and that’s passed, you should now get a prompt like one seen below.
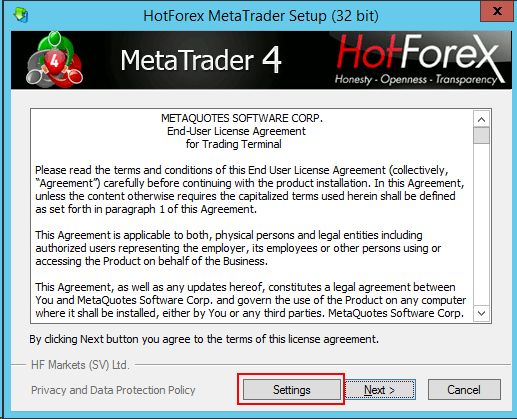
As stated – you can simply hit NEXT until it’s done, but to prevent it from opening the MQL website on completion – go to SETTINGS. For persons setting up multiple versions of MT4 with the same broker (same setup file) you'll go to SETTINGS as well.
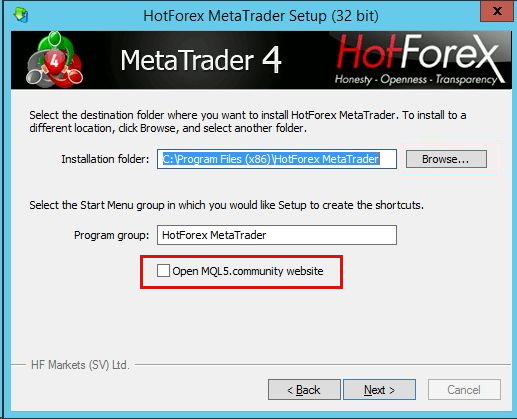
Unchecking the box highlighted above will prevent the website from opening. If you're installing multiple instances of MT4 then you'll add a number to the end of the text. Otherwise - just keep hitting NEXT until it's done.
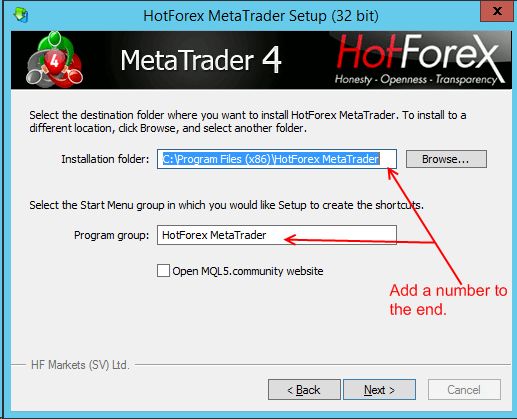
So it would then say HotForex MetaTrader1/HotForex MetaTrader2/HotForex MetaTrader3/etc....
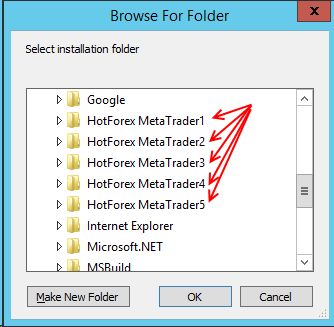
Once again. This is only if you have multiple accounts that you want to set up. If you're in the group of persons that needs this done - you should also be aware that each setup will require adding a number to the shortcut (icon) created on the desktop. If you don't do this, each install will overwrite the shortcut with the last install. So when you setup first - it will go to "HotForex MetaTrader1" - the shortcut will just be called "HotForex MetaTrader". When you set up HotForex MetaTrader2 it will overwrite the desktop shortcut and point to #2 - but since the shortcuts aren't numbered it will launch the last one. You CAN find it under "Program Files" and in your programs list - but it's easier to just number the shortcuts if you're installing multiple instances.
If you're installing from different brokers - you don't need to do this. Each broker will create their own shortcut. You will need to uncheck the "Open MQL" option though.

Once it's done - hit FINISH and MT4 will launch. It will bring up a login screen with information about the server you should log in to. Select the appropriate one and proceed.
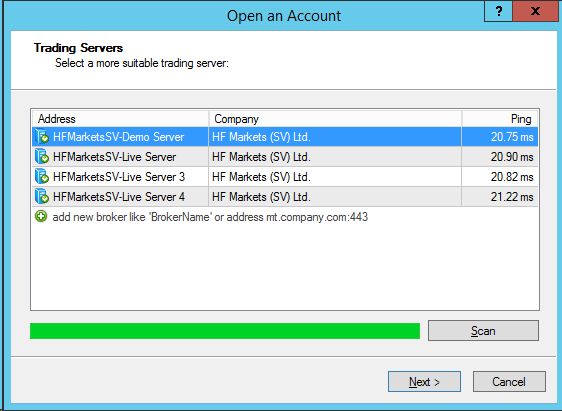
As mentioned in the video as well - you can add a broker server if needs be - but check the video for that (about 7:00 into the video).
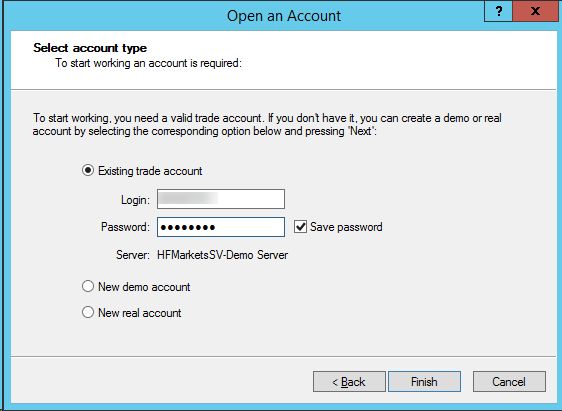
Once you've sorted your server information - log in using the details provided by the broker in your email. Depending on the type of account, you may have the login details on the broker back-office or dashboard somewhere. This may more likely be with challenge accounts. We'll get into that later.
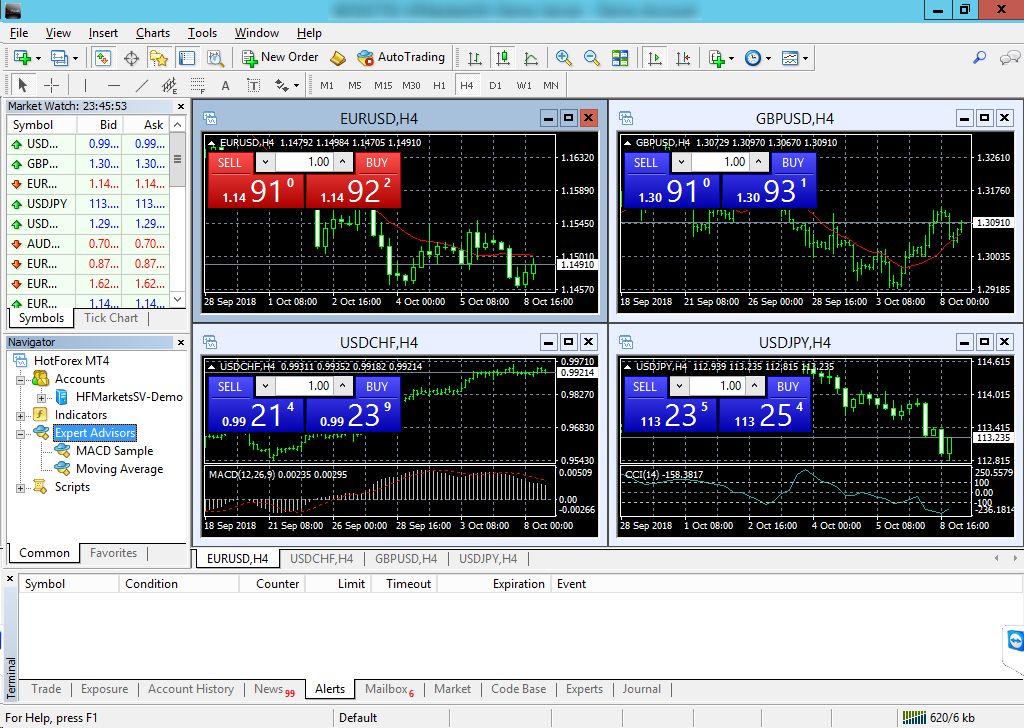
Now that your MT4 is set up you can take trades. Ensure you've done the homework before. Test what you need with MT4 on the demo account. Get accustomed to it before going live.
Secondary Disclaimer
This second disclaimer is to give one bit of info. This site page has zero ads associated with it - as of the update date in the first post. That may change over time, but I intend to have it as clean and quick as possible. The information is provided free of cost. No links of any kind are provided without some notification about what you’re clicking on. This should be true for this entire trading related section of the site. The only things that have no “warning” that you’re clicking a link may be pictures – which may enlarge when you click – links within the site or links externally.
The purpose of this is to give novice traders a starting point and give experienced traders some insight to other methods.
Most of the things in the analysis section will be from actual charts with actual trades taken. As I may have said before – I’m using a small account now to get back into trading. I’ve cut from it for over a year due to massive losses taken around the time my father got sick and then died. This was desperation trading taking place. Over-leveraging. The fact that I’d seen the results and wanted to get better ones.
I make no claim to be an “expert trader” or even one that’s overly experienced. I have however, seen that trading can be fun and can allow locals (Jamaicans) to make foreign currency. The second reason there is a major plus for locals (Jamaicans) as the cost of USD just keeps rising. I remember when JMD$100 could buy USD$3 and some change. Now? It’s a minimum of JMD$150 for USD$1.
Again – if you see something you disagree with – we can agree to disagree. If you see something that’s incorrect or blatantly wrong – notify me so I can fix it.
If you own any of the tools/software referred to and would like any mention/links removed, please let me know.
So let’s move on into getting things done.
Diving In
So you’ve installed MT4 and have your platform up and running. Great! Or not really…It kinda looks daunting. Or a bit too simplistic. Can’t it be a bit more visually appealing?
Color Scheme
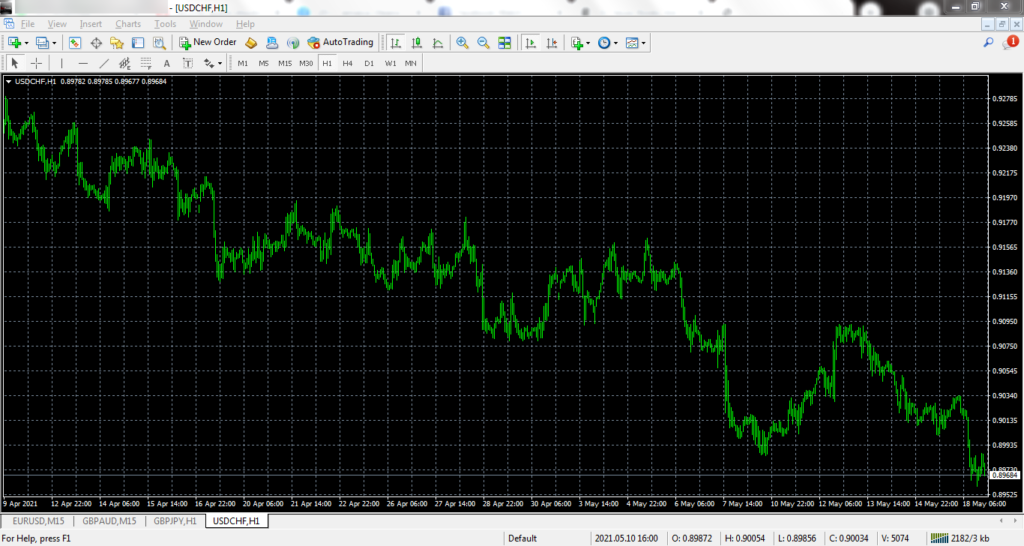
Well. Truth is – it can. The above window is just an example of what your charts CAN look like. Each broker platform has a different default view, but many of them start you off with this. So let’s make it a bit easier to figure out what’s going on. Press the F8 key on the keyboard. This is the same as RIGHT CLICKING and going to PROPERTIES on any chart.
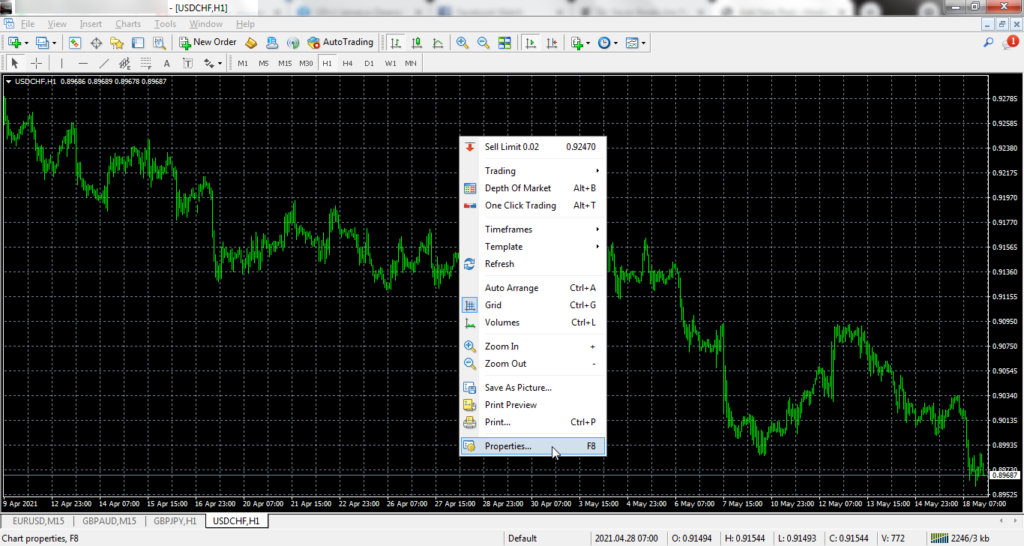
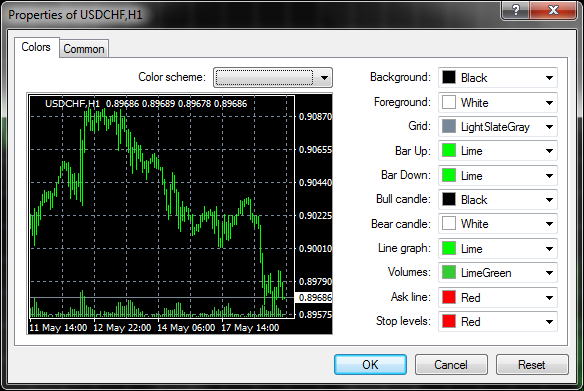
From here you can change the colors of the candles – the chart – etc. So let me show the scheme I use so that you can make it match.
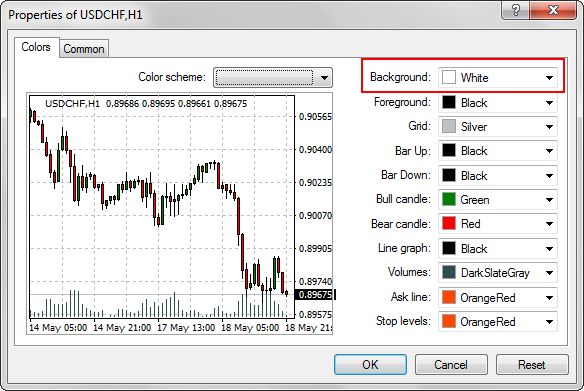
I’ve highlighted the BACKGROUND section as it may make a difference based on your screen and the time of day. If you trade a lot in the night – or have certain indicators on your chart (we’ll cover indicators later) then a darker background may be better. This especially helps if you glance at charts in the night and want to not have a blinding white background.
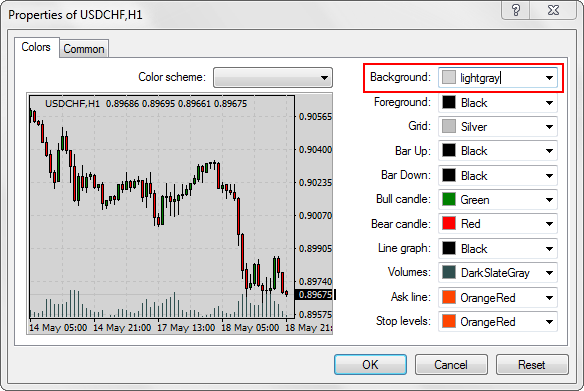
In the above image I’ve literally selected the text in the box – cleared it – typed in LIGHTGRAY. If you know the color and it’s supported by the platform, you can change it to suit your needs.
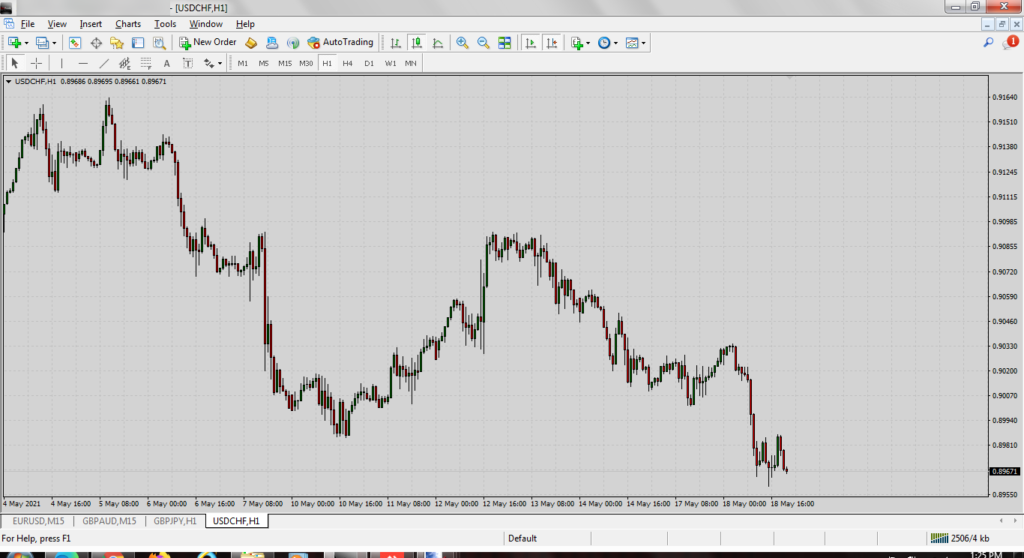
Once this is done your charts. should be customized with a background color that suits you, plus have BULLISH candles as GREEN and BEARISH candles as RED.
Hog And Goat?
Nope. Bulls and Bears. So let’s get into the concept of that.
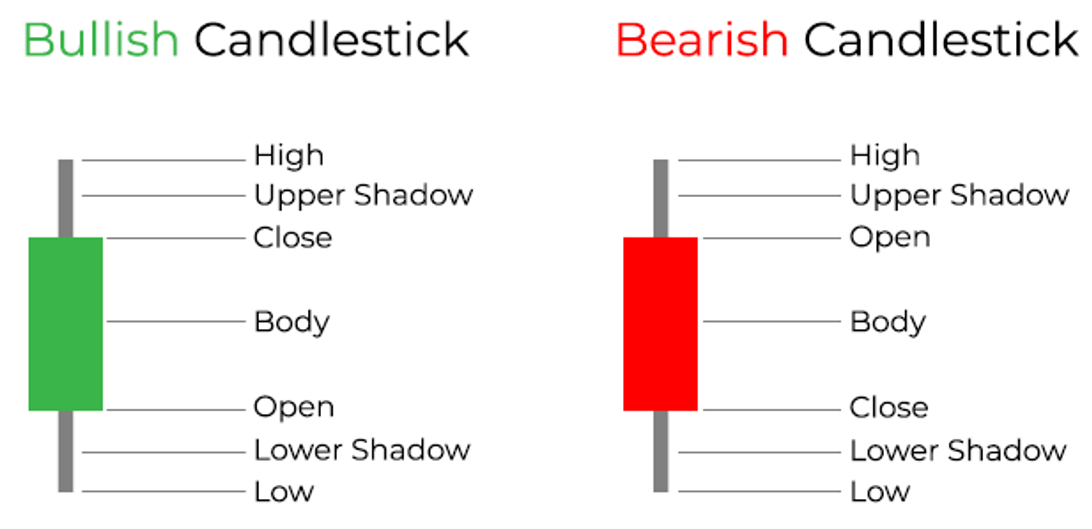
A BULLISH candle/market is one that is going UP. A BEARISH candle/market is one that is going DOWN.
The concept is somewhat like this…if you’re attacked by a BEAR it’s going to try and maul you. Hit you down. Get you on the ground. If you’re attacked by a BULL it’s going to try and butt/buck you and hit you up in the air. Yes – we know – don’t get technical. A bull or cow will end up trampling you at some point – but they primarily attack using their horns to hit you into the air – or in an upward motion.
Red & Green
The reason I choose RED and GREEN is to make things easier. If the candle is RED it means that price is moving down while GREEN means price is moving up.
Candles?
No we’re not lighting anything to see the way. Charts are represented in a number of ways. The three primary ones (photos below as well) are:
- Candlestick Chart
- Bar Chart
- Line Chart
Use the three buttons shown in the image above to cycle between the types of charts.
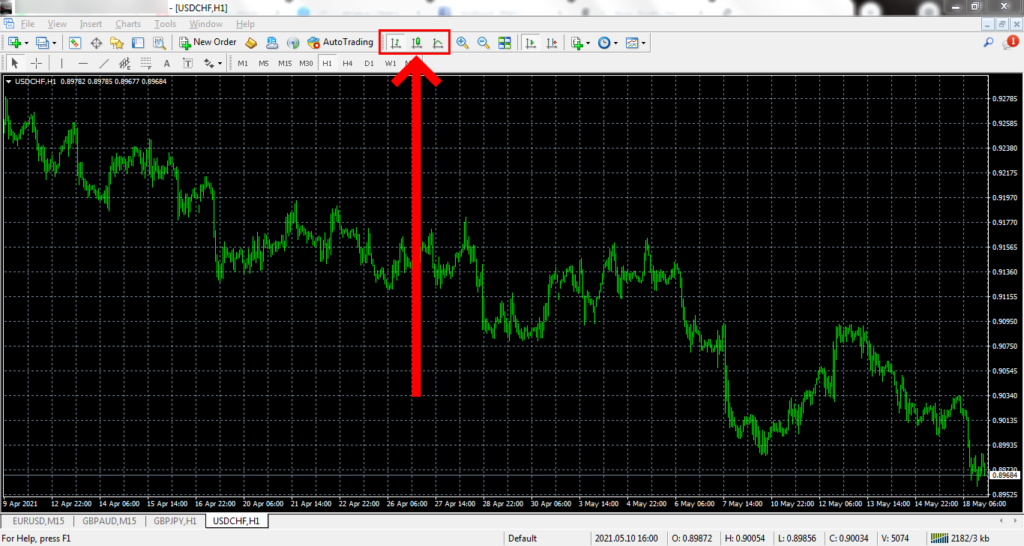
Use the three buttons shown in the image above to cycle between the types of charts.
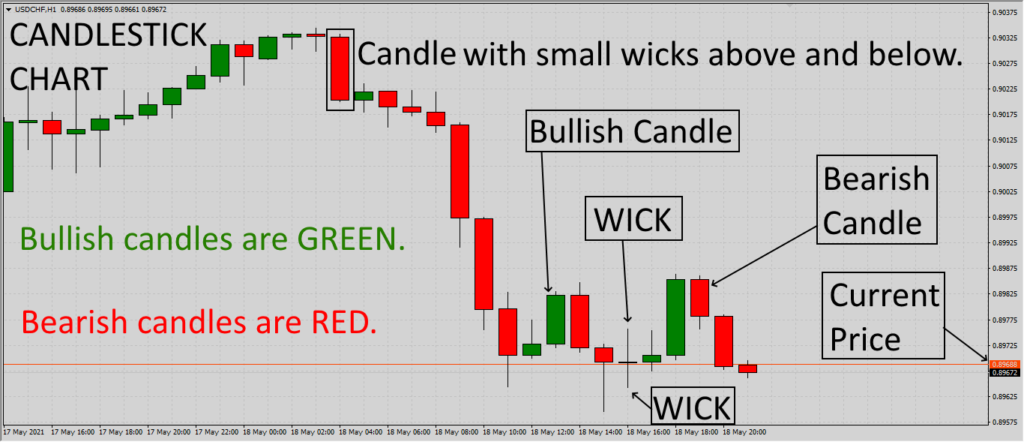
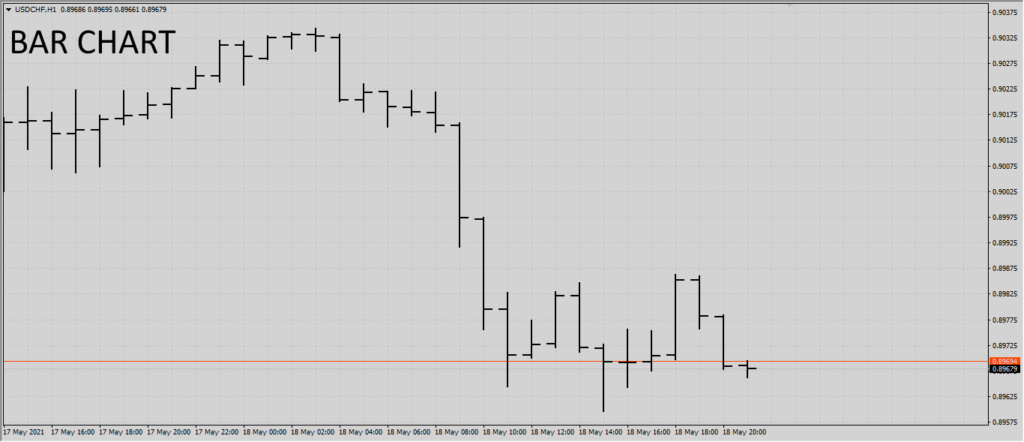
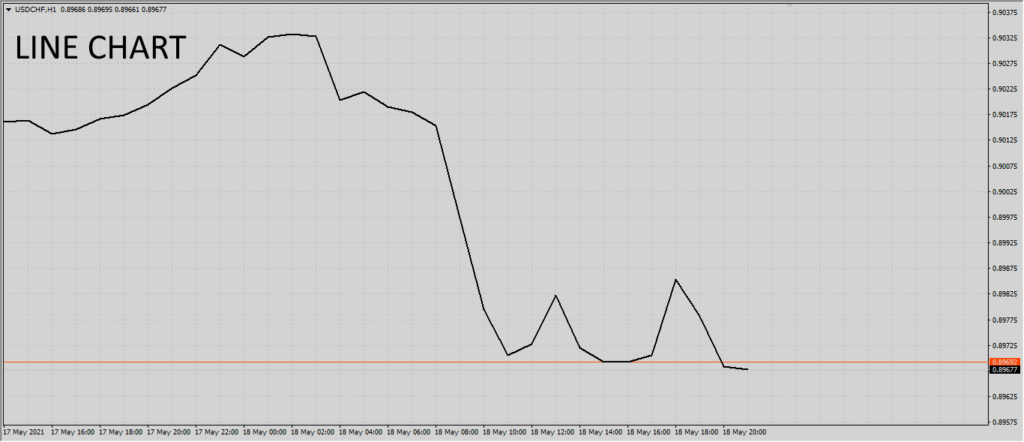
The CANDLESTICK CHART is the most common you’ll see. Each person may have a different color scheme, but the general overview should be the same. Here are some notes about the candles if you changed your color scheme as indicated previously.
- BULLISH candles are GREEN.
- BEARISH candles are RED.
- Candles can have WICKS above or below – or both above and below.
Candlestick charts and bar charts are called OHLC charts. This is because they show the OPEN, HIGH, LOW and CLOSE of price on each candle/bar.
Personally I find it much easier to use the candlestick chart. So let’s get into the whole OHLC. It’s just for information purposes and shows you how price moves.
OHLC
I’ll only be able to tell you about this on the candlestick chart. I have no idea how it works on bar charts. Well – not entirely. I just can’t see it as easily as I’ve gotten so accustomed to candles.
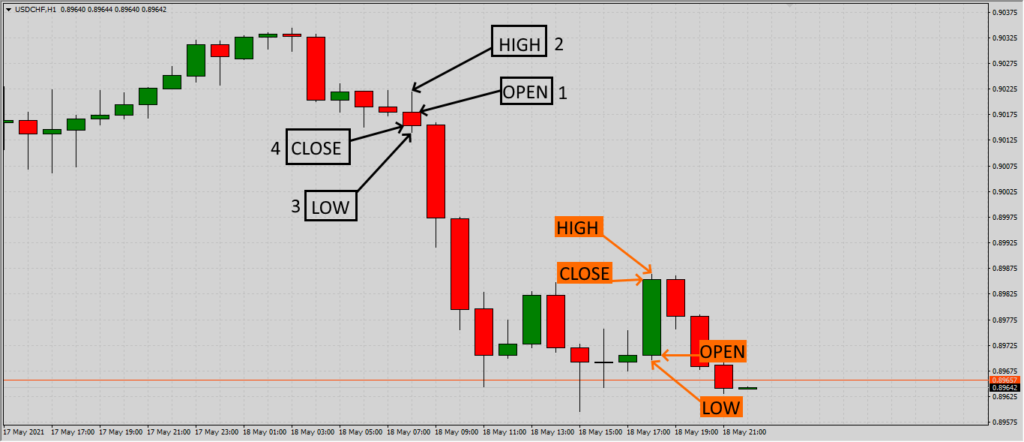
Particularly for the image above – I recommend opening it up by clicking – downloading if you need to – and looking at the difference between a BULL and BEAR candle.
Basically – the BEAR candle:
- Opens at the top. Meaning price (the candle) was formed above it.
- Creates a HIGH and LOW above/below the overall candle.
- Closes at the bottom. Meaning after all the movement up and down – it closes below where it opened.
Basically the BULL candle:
- Opens at the bottom. Meaning price (the candle) was formed below it.
- Creates a HIGH and LOW above/below the overall candle.
- Closes at the top. Meaning after all the movement up and down – it closes above where it opened.
Consecutive BULL candles (left of the chart) or areas with more BULLS present would be considered an UP TREND with price moving higher and higher.
Consecutive BEAR candles (right of the chart) or areas with more BEARS present would be considered a DOWN TREND with price moving lower and lower.
The Line Chart
The difference between the line chart and the others categorized as OHLC, would be that line charts only consider the CLOSING PRICE. OHLC charts (candle and bar) give more information about what happened to price – the line chart is only concerned about where price finally stopped.
While I don’t use the line chart for general trading, I do use it to gather certain bits of information. But this will be delved into later on.
Actual Trading
Now that you have an idea of what to do – I guess you’re ready to dive in. At this point you can. I expect that you’ve done the introduction and downloaded/completed the game that I suggested. If not – please go back using the link below and complete the game.
From this point I’d also expect that you’ve opened a demo account with a broker or through MQL and are ready to start with getting accustomed to the platform.
If you’ve gotten here and still not signed up with a broker – please use my affiliate link below to sign up. From here you can play around with the platform – get familiarized – and take some trades on the demo account. Going on from here we will get into analysis and actually taking trades without blindly tossing a coin and hoping for the best.
https://www.hotforex.com/?refid=311323
The link above goes to one of the brokers that I use. I’ll go into more details later on about why I use them. Until the next post – go ahead and sign up. Download the platform and set it up then play around (on demo) with taking trades. If you don’t remember how to do the setup – the link below will guide you along.
http://icmarkets.com/?camp=61727
That next link is the other broker that I use. Depending on what you plan to do - swing or scalp - and depending on the tools you'd like to use - one may suit your tastes over the other.
HFM - HotForex - they have the most available tools compared to other brokers. They have a lot of available platforms and such. The also offer a web trader in case you want to log in and trade that way.
ICM - International Capital Markets - has been known for having some of the lowest spreads of any broker. Unlike HFM, their accounts have commissions associated with each trade position taken. You can get lower spread accounts on HFM - not still not as low as ICM.
If you plan to swing trade - I recommend HFM. If you plan to scalp - I recommend ICM.
Once more – ensure you’re doing all trading and testing on DEMO. Do not add live cash to your account and start trading until you have at least a fair understanding of what you’re doing. Please read over the DISCLAIMER information above . You can go ahead when you think you’re ready – but let’s get some groundwork out of the way first.
So Far
By now you should have an understanding of what Forex is and know about the trading platform. From here we will move into doing analysis and taking trades, but as you’re on demo you can go ahead and play around with the terminal. Get familiar with it. See the differences on your phone – if you’ve set it up.
Once more. Trading isn’t for everyone. But if you manage to get it down, you’ll have something that will pay you in USD.
Please remember that this is not a “get rich quick” scheme. You can make money but you stand a very real chance of losing your entire deposit. Tread carefully and ensure you work out the bugs on your demo account before moving to live.
The “Right Way” To Go About It
There is really no right or wrong way to go about it – provided you’re making profit. The way trading works, you can almost take risky gambling trades from a coin toss and be right half of the time. The issue is, if you’re not sure about how some things work you’ll lose everything in a very short time.
Analysis
You should first take a look at things and decide what you want to do. It’s like going on a journey and using a map. In the past the way you navigate is by physically looking at the map and planning your trip. Even Google Maps and other GPS/navigation systems at times will offer multiple routes to your destination. The point is – you want to pick a direction before just getting up and driving. You CAN just pick a direction, but with Forex that may lead to a blown account. Leave the random directions for adventure driving.
Up Or Down?
Forex makes things seem pretty simple. You pick one of two directions. A coin toss. Up or down. Let’s take a look at what factors lead to making the decision.
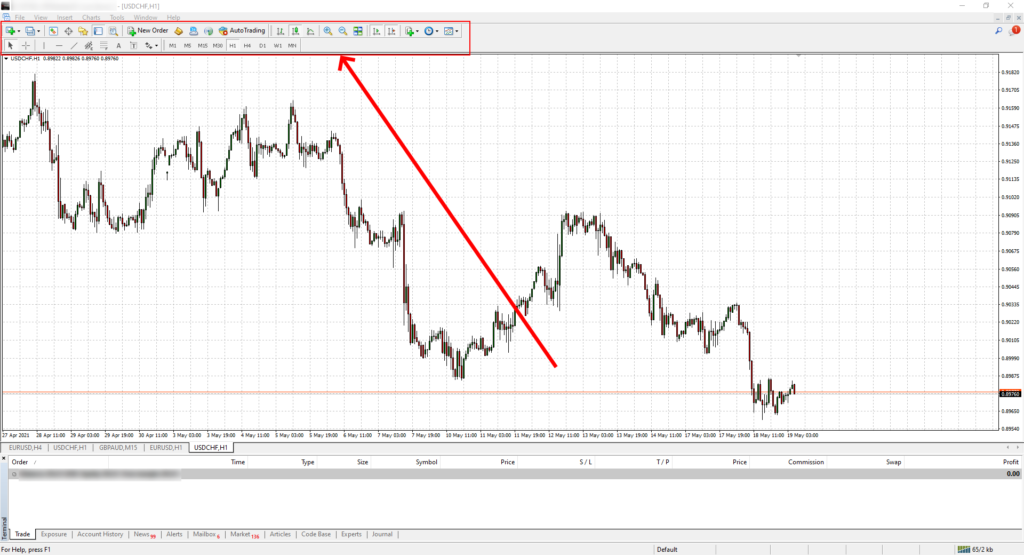
At the top of your MT4 terminal is the toolbar. Or bars. There you have shortcuts to various things that you can use. We want the MARKET WATCH icon – which can also be accessed using the keyboard combination CTRL+M.
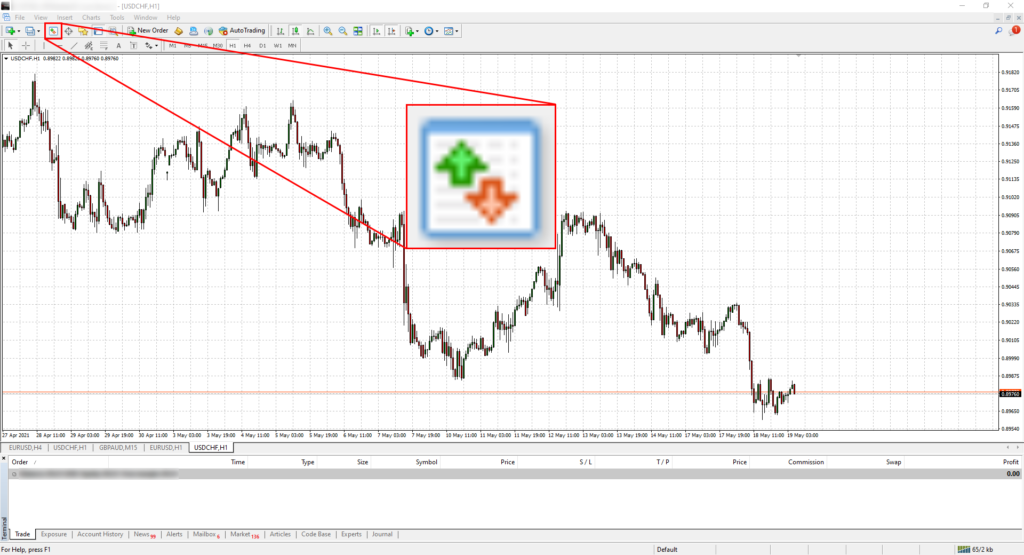
Once you click the icon above – or use the shortcut keys – the MARKET WATCH should pop out on the LEFT side of the window.
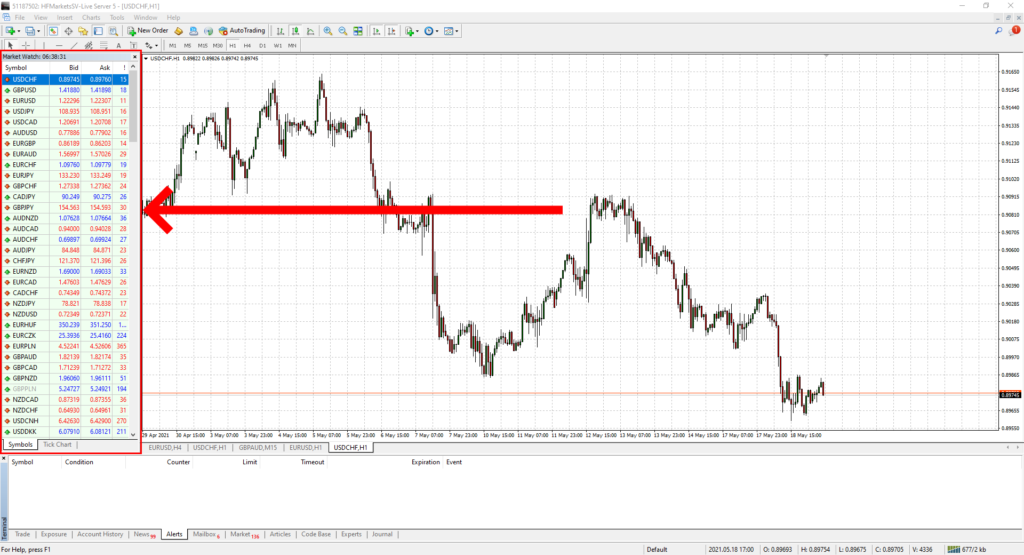
This may look different from yours, but the general idea is the same. You should be seeing multiple CURRENCY PAIRS on the left of the terminal. RIGHT CLICKING on one and going to CHART WINDOW will give you a new chart.
Currency Pair?
In Forex, every single currency that can be traded is paired with something else. USD with CAD, or JPY or EUR or GPY – etc – etc – etc. You are given a number of pairs to choose from. Your options are BUY or SELL. Let’s take EURUSD for example – the EURO/UNITED STATES DOLLAR pair.
If you BUY EURUSD – you’re effectively saying the EUR will do better than the USD. If you SELL EURUSD you’re effectively saying that USD is going to do better than EUR. It’s a funny situation – but BUYING is essentially investing in EUR, while SELLING is the equivalent of investing in USD.
You’re basically “betting on” which currency is going to be stronger than the other.
The Pairs
Here’s a listing of some of the pairs.
- USDCHF
- GBPUSD
- USDJPY
- EURUSD
- AUDUSD
- USDCAD
- EURCHF
- EURGBP
- EURJPY
- EURCAD
- EURAUD
- GBPCHF
- GBPJPY
- CHFJPY
But you have WAY more than that. I won’t list them as above, but to give you an idea there’s:
AUDCAD,AUDCHF,AUDJPY,AUDNZD,AUDUSD,BTCUSD,CADCHF,CADJPY,CHFJPY,EURAUD,EURCAD, EURCHF,EURGBP,EURJPY,EURNZD,EURUSD,GBPAUD,GBPCAD,GBPCHF,GBPJPY,GBPUSD,GPBNZD, NZDCAD,NZDCHF,NZDJPY,NZDUSD,USDCAD,USDCHF,USDJPY,XAGUSD,XAUUSD.
FYI – in the above list there’s spaces between the end values – had to do that so it would fix a scrolling across issue.
That’s a lot. And for those who noticed – yes it includes gold, silver and BitCoin. With so many to choose from you can make profit daily, but it’s still not as easy as it sounds. It’s physically impossible for a human to scour every single pair and get optimal entries for each one, and this is why people have created tools to do it for you. Just bear one important thing in mind. No tool should be used blindly. Most persons make the mistake of purchasing or finding a tool that operates according to their rules or part of their rules. This tool may partially or entirely follow what they would do – however it’s best to take the indication from the tool and do further analysis before deciding on a buy or sell.
What we’ll be doing is going through some of the manual steps for making a decision using as few tools as possible. From there you can find/purchase tools to make things easier, but at least you’ll have the basics down and can operate properly moving forward.
Taking a Trade
FINALLY! This is what you came for right? Well – let’s do it! Open your MT4 and hit that NEW ORDER button at the top of the toolbar.

Yes I’m being a bit mean. You need to find that one for yourself. Once you do, you should get a window like this one.
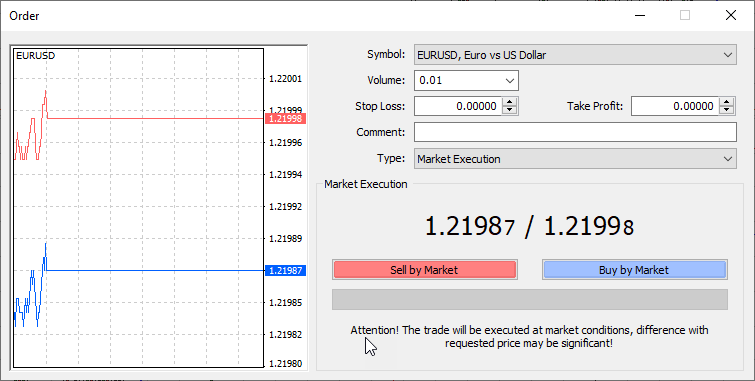
Before you hit BUY or SELL though – ensure this is a DEMO ACCOUNT that you’re using. I don’t want you to blame me for any losses you incur while doing this. If you’re sure about using the account you’re on, go ahead and hit that button. Any one. With that – you’ve successfully taken a trade!
Now watch that trade as it goes in or out of profit. You’ll see your balance and equity fluctuate and a new order should appear in the TERMINAL WINDOW at the bottom of the chart. Now let’s put things into perspective a bit by looking at the chart in a bit more detail.
Analysis – 1
While this is doing things a bit in reverse – since you should have analyzed before taking it – let’s go ahead and check whether or not we took a good position up.
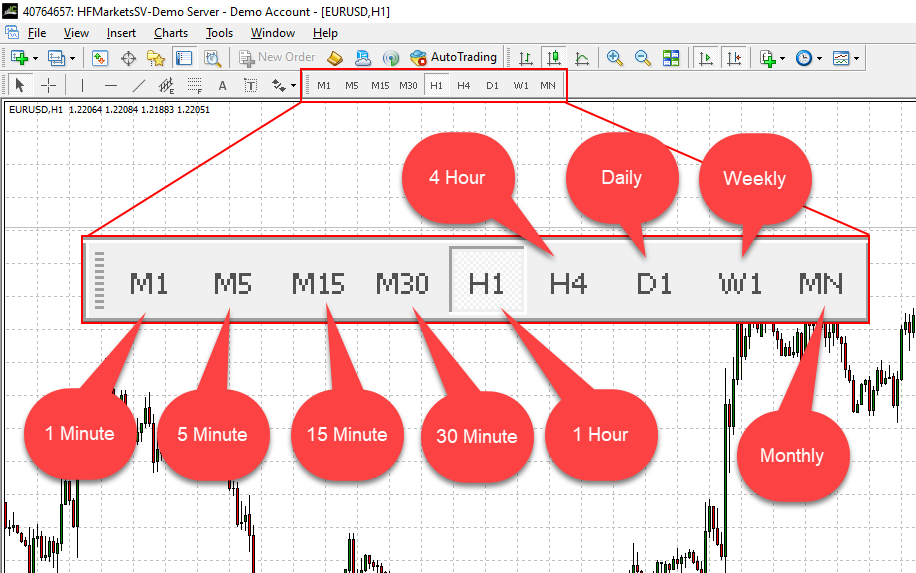
Looking at the top of the chart you’ll see this toolbar. I’ve broken it down into what each one should do. This changes the TIMEFRAME for the chart so that each candle you’ll see represents the timeframe chosen.
This means that each individual candle can represent as little as 1 minute or as much as 1 month. Through the course of the information provided I will primarily be using 3 of them. The M15, H1 and H4. I may switch to others depending on the type of analysis being done, but those three are the main ones that will be used.
Before choosing a timeframe, let’s do a few things to make our analysis better. We’re going to:
- Add timeframe separators.
- Add a 50 period moving average.
- Add a 200 period moving average.
This will give a basic idea of what is possibly the simplest strategy for trading used in Forex – the MA CROSS strategy.
MA Cross
The MA cross means Moving Average Cross. This is sometimes referred to as Moving Average Crossover – but it’s the same thing. The moving average is a line plotted on the chart using a mathematical formula. It takes an average of the number of candles that have occurred and plots it on the chart. In the case of a 50MA it’s 50 candles – the 200MA is 200 candles.
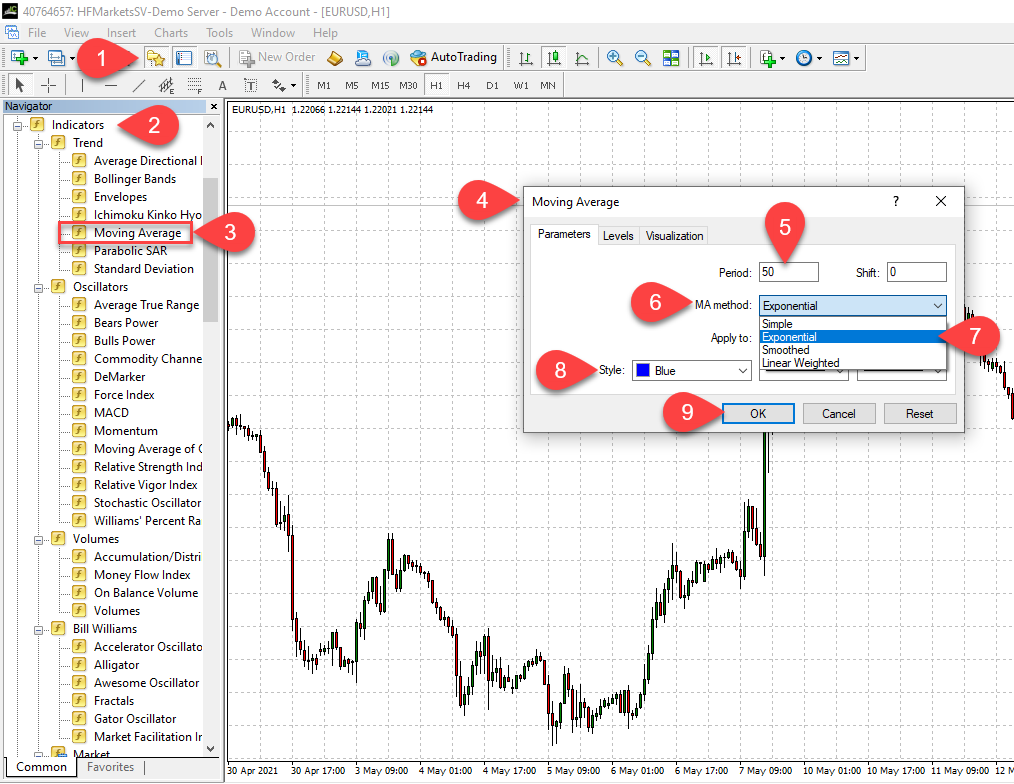
Open up the NAVIGATOR. This can be done by clicking at step 1 above or pressing CTRL+N on the keyboard. Open the INDICATORS list by expanding it. That means clicking on the plus (+) which should change to a minus (-) revealing the indicators. DOUBLE CLICK on the Moving Average (step 3) or drag it onto the chart. This should open up the settings for the MA (step 4) and now you can change the settings. Change the method to EXPONENTIAL, the style to BLUE and then hit OK.
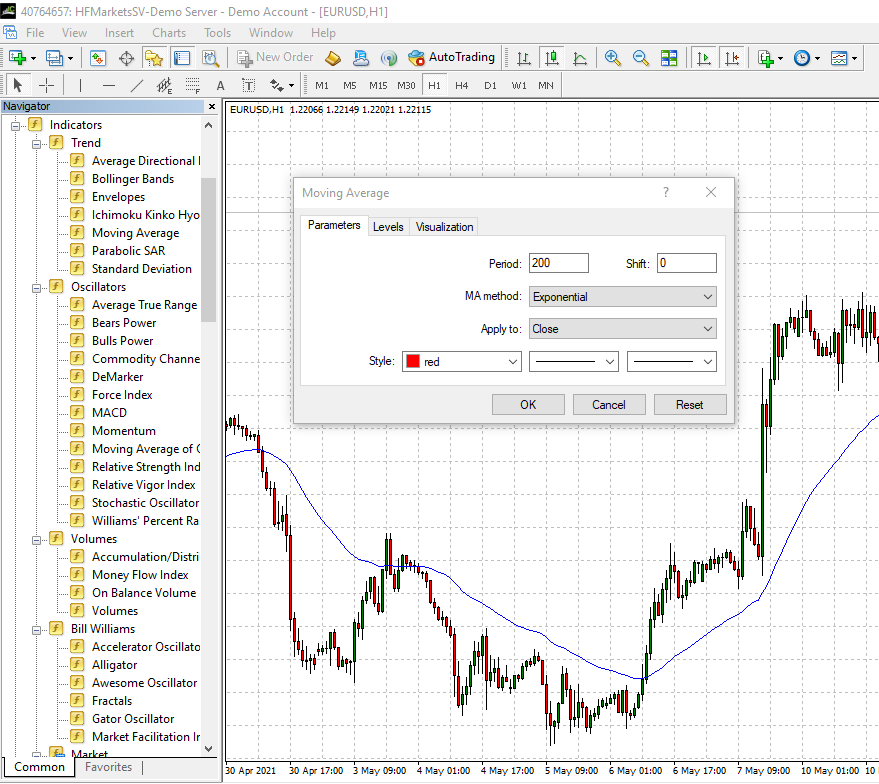
Do the same steps for the 200MA. Just ensure it’s set to 200 and color is RED. Once done, close the navigator and your chart window should look like below.
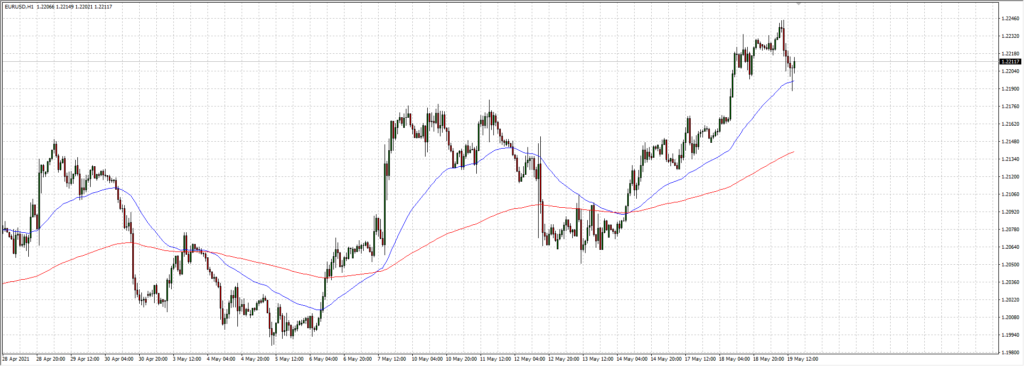
This gives a very basic trading strategy. Once the RED is above the BLUE – you sell. Once the BLUE is above the RED – you buy.
You can apply this method to each timeframe, bearing in mind that timeframes are fractal in nature. And once you place an indicator on a chart – it stays on each timeframe.

https://en.wikipedia.org/wiki/Fractal
You can see other definitions in the link above. If you’ve ever seen the movie “Inception” then you also get an idea of what it is.
This basically means that the same pattern exists in each timeframe. So the movements of the price, expressed in candles, bars or lines, can be seen throughout the chart regardless of the timeframe.
In Closing – For This Section
That should be enough for now. A lot of info to ingest. Watch you trade on your DEMO ACCOUNT and play around with the terminal. Close it – open another – switch timeframes – play around with things. You are allowed to make mistakes – you are allowed to lose during the learning process. Do not trade on live until you’ve successfully traded your live account and feel comfortable with the strategy you develop.
The MA cross strategy works, but requires a lot of patience. It may need other things to supplement making the decision, as the development of the cross may be well into a trend or cycle. We will start to go more in-depth moving forward, but hopefully by now you have an idea of what it’s like to take a trade. Yes I know – I didn’t tell you how to close it or anything, but will go into more detail as we progress.
The link below is to a playlist on YouTube with videos by cTrader – one of the trading platforms I mentioned earlier. It is a great way for persons to be introduced to the basics of Forex.
The direct link to the full playlist is here: https://www.youtube.com/watch?v=PKkNjY2oorU&list=PLu_M4_N3SBoK8zRFr9OIdowWf9F3_deoC
Alex Katsaros – the product manager at cTrader and the person doing the videos – does a great job of explaining things IMO. English may not be his first language based on the accent, but he makes it pretty clear and easy to understand.
To be honest – if I could move some of the indicators and tools that I have in MT4 over to cTrader I would. The amount of information he gives and the detail – that was enough to sell me on the platform. Just by that. Sadly I’ve never used it though.
If you’re following things here, the videos should keep you occupied for the day until I’m able to put up the next bit of info.
One of the things about the videos – and about information in general – is that I go over it again and I see more each time. Due to the nature of Forex and the way the information is delivered, it carries a simple breakdown but has complex background information. Even with more experience, once you review the details you may see something you either missed or didn’t realize previously.
FYI – for persons not using indicators of any kind – you can use any trading platform. The main reason I’ll trade from my desktop and just monitor/manage from my phone is due to the size of the screen and the amount of information. This means it’s easier for me to analyze data from my desktop/laptop than from the phone due to the size of the screen.
The secondary reason I trade from my desktop is due to the indicators I’ve become comfortable with. While I can do analysis without them, I find it easier to look at the charts that I’ve become accustomed to and give a quick analysis.
Enjoy the videos and hopefully they’ll fill in any gaps I’ve missed.
Take the time to play around with MT4 and figure some things out with taking a trade and modifying it. In the next post I’ll try and figure out what you may or may not have seen or have done. Have a good one!
Terminology
Don’t worry about the words used – the indicators or things that you don’t know. As things progress with this I’ll go into detail about all of the tools I use and why I use them. I’ll also post details on how to set up your chart and why mine is the way that it is.
I’m going to do this again in the next post, but let me give a quick review of what’s on my chart.
Indicators
- 50EMA / 200EMA
- QT Zones
- TDI
- High/Low Indicator
The EMA is an Exponential Moving Average. The 50 (blue) and 200 (red) period on my charts are major MAs that are used by financial institutions from what I’ve learned. The 50, 100 and 200 are major ones, but I only use the 50 and 200. There are strategies for using lower period MAs for entries, but will get into that later on. The EMAs are built into the trading platform (MT4).
The QT (Quarter’s Theory) Zones shows static areas on the chart where price is likely to react. A method used is to mark your zones manually, but the QT gives you static areas. Price may react CLOSE or ON a QT zone, but also at ROUND NUMBER zones. So in EURUSD, 1.20000 is a major zone, but humans understand money in dollars and cents. While price can move to 1.20500 humans will react to $1.20 / $1.21 / $1.22 etc. So the QT zones will break down between $1.20 and $1.30, but there are areas within there not marked by QT zones where price may react. The purpose of the QT zones is to reduce the work required for you to mark up the charts. The QT zones can be found free online.
The TDI (Trader’s Dynamic Index) is a paid indicator that also has free alternatives available online. It helps with finding divergence and showing over bought/sold areas of price on the chart.
The high/low indicator shows the previous day high and low. This helps with seeing where price is NOW versus where price WAS – and can help with finding entries based on the high and low.
Method Breakdown
The method I’m using for trading is derived from a plethora of things. There’s lots of books I purchased and videos and such – and some things that I also found and read online. One of the methods I learned from was Steve Mauro’s MMM (Market Maker Method). While I didn’t purchase and do the course, there are LOTS of resources online where people discuss the method.
Something I realize is persons miss the point. Saying all taxi drivers stop or turn without turning on their indicator doesn’t mean ALL taxi drivers do it – and it doesn’t mean that one you didn’t see doing it will NEVER do it. In the same way, Steve spoke about trading off the weekly high/low after a “false move” at the beginning of the week. This doesn’t mean that EVERY week will have a false move. It means you look for it to happen and then move from that established point. Doing so will give you less losses. That’s the bottom line.
Another thing I realized is that you’ve got lots of different methods, but there are really 4 primary categories. Aside from the methods like the “lunar cycle” trading ones, you have:
- Long term
- Short term
- Trend trading
- Reversal trading
Between LONG and SHORT term trading is the MEDIUM. Short term trading can be from scalping for a few seconds to day trading. Medium term can be a few hours to a week or two. Long term trading can last for days, weeks or months at a time. You enter and don’t close for that long.
Trend trading is identifying a direction and following it. Reversal is attempting to identify a top/bottom or area where price will turn, and entering there for maximum profits.
My Method
While I mix a number of things to create my rules, the basics would be these.
- Wait for the high/low of the week to be established.
- If no high/low can be easily identified, wait for price to reach a QT zone.
- Look for divergence.
- If not divergent, check for overbought or oversold conditions.
- Check if price is near the previous day high/low before entry.
- SL should be set at least 25 pips behind the entry point zone.
- 25 pips above/below the zone if possible.
- Other options include being above/below the high/low of the week.
- Check for news.
- Aim for 10-20 PIPS per day.
One mistake that most persons – traders or not – make is looking for MONEY. They equate making $100 per day to being more skillful than making $1 per day. This is a misnomer due to the METHOD of trading. If someone has a large account that they can make $100 off 10 pips using 1.0 lot trades. The SAME 10 pips would make $1 using 0.01 lot trades. And yet again – THE SAME 10 PIPS would make $1,000 using 10 lots. Is your account large enough to withstand the potential drawdown and make $1,000 per 10 pips? Most persons reading this won’t be able to do so.
Focus on your PIPS – the dollars will come once your account grows more.
That’s it for now. I’ll get into the methods more and how to install/setup then get things rolling. Oh. I did say 10-20 pips per day for me right? I also use a “Trade Report” indicator to show what my total pips/profit has been for the day/week/month.

I’ve made 50 pips for today so far. That means that for the rest of the week I can take things easy. I’ve made my target if it’s 10 per day. I don’t need to hunt for the rest to make 100 at the end of the week. If I don’t see any possible trades – I’m not taking it. Let’s see how it goes.
The actual rules are a bit difficult to follow when you have other things to do. So here we go.
- Check the direction on the higher timeframe – H1/H4/D1.
- Enter in the trend direction on the lower timeframe – M15.
- Prior to entry – check for zones or round numbers nearby. Price will reject off those.
- Check for TDI being overbought or oversold.
- Check for divergence.
- Check for harmonic patters.
- Check for signals with any other tools you may use.
I got into all of those because I want to also discuss tools that I use and have used. I’ll get into more detail about each one. Each link below takes you to the website of
- Moving Averages.
- TDI.
- Dennis Buchholz (FXBook Link).
- Uncle Lee.
- Point-Zero Trading.
I’ll be going into detail on each one and give an overall review at the end of it.
Moving Averages
These are built into MT4 and can be set to whatever parameters you need. The primary ones used by me are the 50EMA and 200EMA. I’ve been testing the 5EMA and 13EMA for entry purposes. In both cases the higher EMA being above means a down trend, while the lower EMA being above means an up trend. The exception with the higher value EMAs (50/200) is that they’re used for longer term trends. Price also sometimes touches one or the other before continuing on the way.
TDI
The TDI is used as an additional indicator to give a good idea of price movements. It appears to be a “pretty RSI” but it does have some other functions that make it worth having. It shows price divergence and can send alerts. Using a desktop/laptop/VPS you can get signals on your phone.
Dennis Buchholz
Dennis has been doing trading systems for some time now. There have been mixed reviews by persons who have said the systems don’t work and those that swear by it. The FXBook link shows the success of the systems once deployed in the way he specifies. Licenses are tied to your account number and can be moved at no extra cost – but you have to send an email and wait for it to be done.
Uncle Lee
Lee Starks (Uncle Lee) has been trading successfully for quite some time now. A friend of Dennis, he is for more available than Dennis for help with the various trading systems. Having used them Uncle Lee has refined the techniques and then created his own systems based off Dennis’ ones. Uncle Lee had started a trade copy program but closed it down due to multiple negative reviews – instead he continues to assist persons in various groups with refining their trading systems. His own personal results are far better than the ones when he was managing the trade copy system and, as with Dennis, there are mixed reviews for and against the systems. Licensing is tied to your account – I’m not sure of the current license move model.
Point-Zero Trading
This website has MULTIPLE tools that are available. Reviews are overall good and the licensing is the best I’ve seen so far. No need to call/email/write/request to have your license moved – simply wait until midnight and use the tool on a different account. So you own the license and it’s not tied to a specific account. You just need to wait and then the license will be unlocked at midnight. The system will check if the indicator/EA is active on an account and lock it for 24 hours. This repeats every 24 hours automatically – so no need to get in touch with anyone to do anything.
There’s LOTS of tools available, so look through for what you want. There are free and paid tools, so review and decide on what to use based on your trading strategy.
TRADING SYSTEMS OVERVIEW
This is a general view of all trading systems – regardless of where they come from. I’ve said this before and I’ll say it again. EVERY SINGLE SYSTEM WORKS. Even the lunar cycle trading systems (which I find crazy) and any other system – it works. If you stick to the methodology and don’t deviate from the rules – you should get the desired outcome.
The problem with trading systems is that there isn’t a “one size fits all” type of system. I’ll reiterate that.
That link is to the results of what’s probably the best FX robot available. The stats don’t lie – but my own experience with it has been less than favourable. I’ve used it and had mixed results. Does it work? Yes. Does it work as advertised? Not for me. For some reason.
Having used and tested A LOT of different things, I can tell you for a fact that they all work – and none work. Paradoxical? Yes – and here’s why.
Every system has specific rules and conditions that they work under. Even the ones in the link above – I’ve seen where persons swear by them and others swear that they’re crap. I’ve used each one and gotten varying results – but comes the question…outside of the EAs (robots) – have I followed the rules for each system EXPLICITLY? I can’t honestly answer YES to that question.
At the end of it all – you need to find a system that works for you. Find one. Make one. Adjust an existing one. You have to trade in a way that suits your available time and your mindset.
Again – trading isn’t for everyone. You can find that you have ups and downs – or that you lose far more than you gain. If you find that it’s not for you – get out – leave it. You can try other options like eToro or such I guess – where you can copy successful traders for a fee. But in the end – it’s entirely up to you.
Broker Leverage Changes
This was needed based on changes with the brokers. There are various regulatory bodies worldwide for Forex. Check these links.
https://www.moneyhub.co.nz/forex-regulation.html
https://fxnewsgroup.com/forex-news/regulatory/asic-matches-eu-regulators-with-30x-cfd-leverage-cap/
https://www.investopedia.com/articles/forex/011515/us-regulations-forex-brokers.asp
I’ll simplify. Forex has been around forever. Much like investments, Forex started becoming more widespread with numerous options available to the common person. You no longer needed a minimum of USD$10,000 to open an account.
The problem came in with the market saturated with brokers, and people jumping in with zero understanding of what they’re getting into. Some persons would mortgage their homes to throw money at this “get rich quick” thing only to lose it all. You get high leverage which makes it easy for you to earn quickly. But you can lose just as quickly. And people didn’t grasp that concept.
Brokers en masse started to follow suit. Leverage got reduced from 5,000 down to 50 with some brokers. USA residents can now only trade with a leverage of 50:1. Some brokers still allowed higher leverage like 500:1 or 1,000:1 – but these were very hard to find.
I’m not a USA resident – so none of those really apply to me – so I would appreciate the higher leverage. Fortunately, some brokers validate your residency and remove the restrictions based on that.
ICMarkets was my preferred broker. They charge commission, but the spreads were so tight/low that it was easy to get in profit from your trades – especially as a scalper.
When ICMarkets lowered the leverage, I moved over to FXChoice. Good broker overall – but I really didn’t like how the platform “felt” if you get what I mean. Not as bad as some other brokers that you SEE the market manipulation – but some things were just….off.
ICM then allowed higher leverage on a different set of servers. Was unaware until a few months ago so I reopened an account with them.
As I’ve said, you need 3 sets of rules for 3 market conditions.
- Trending
- Ranging (Consolidating)
- Reversals
You need to decide if you’re more suited for scalping or long term trading.
You can’t get away from the work. Some systems will give good pips, but you need to follow the rules. Look for the various things. And try to not deviate from the established rules. If you do so and the system isn’t working for you – and you honestly followed the rules – then change it.
Any system should be tested on at least a small live account for 3 months. You’ll be able to gauge the effectiveness in various market conditions.
So. What do I do? Wait for the patterns. Preferred on the H1 and above. Enter on the M15. Some patterns may show on the M15, but take those with caution.
In the last picture, that’s a double top (M) formation. There was a stop hunt above, but checking it on a line chart will eliminate some of the noise. Enter on the second leg, or on a retracement up.
Apply the methods for each condition once you identify the market state. Don’t rush into the trades. The market will take your money.
Spread, Swap, Gaps & Slippage
This part is updated on 2022-10-30 as it was pointed out that I didn't cover this part even though I've mentioned the terms before.
SPREADS
This could be classified as "the cost of doing business". Have you been to the bank and noticed that they have a buy/sell price on the board for foreign currency? And Sometimes they have a price for foreign cheques as well. So let's say the bank will buy USD from you at JMD$150 but they sell it to you at JMD$155. That's a JMD$5 difference in the price. You could call that the spread.
In trading, the spread is the difference between the ASK and BID price and is usually a few pips. If you look at your MARKET WATCH and enable the option, it will show you the spread in PIPS.
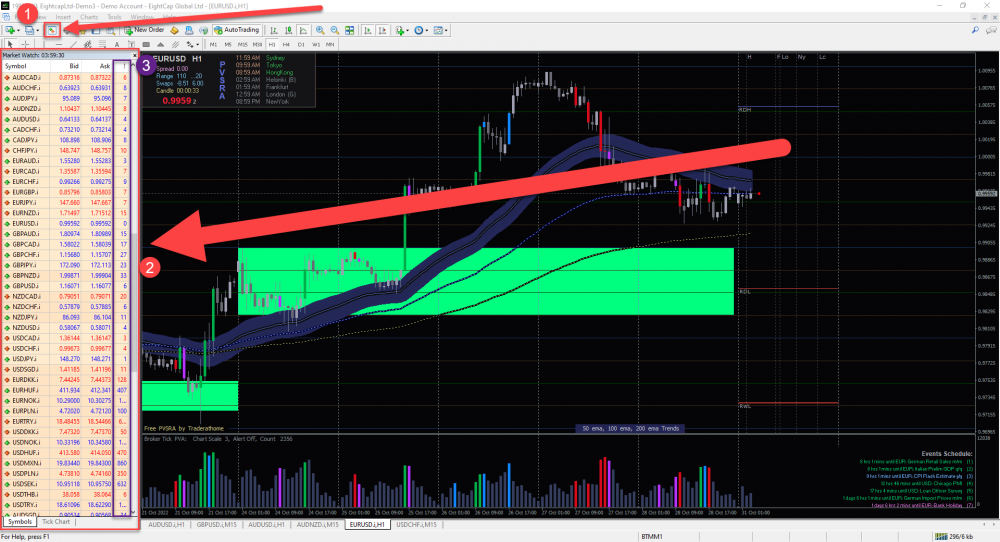
You first need to hit the market watch option at the top of the toolbar. You can also open it by pressing CTRL+M. You should then see your available symbols (pairs) along with the bid, ask and spread.
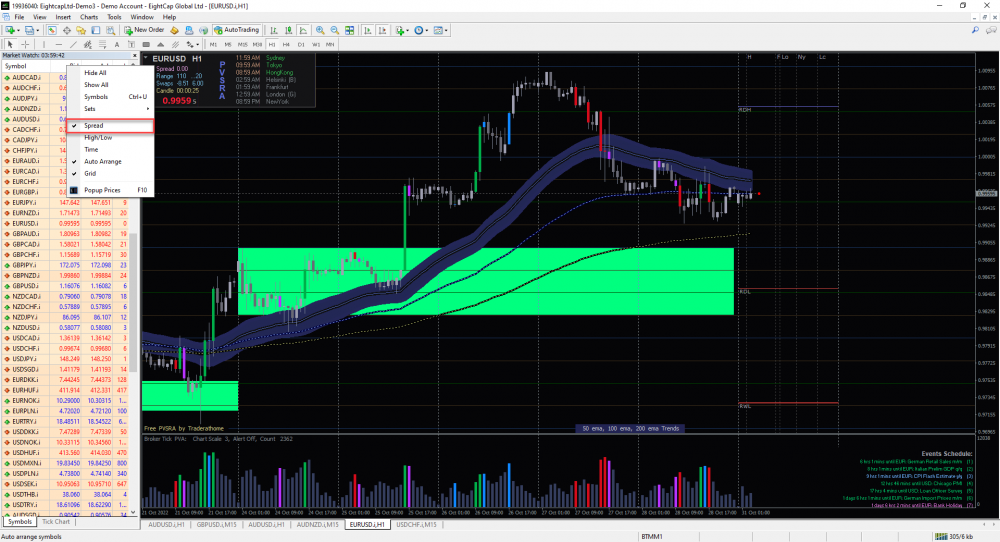
If for some reason the spread isn't visible - RIGHT CLICK in the market watch area and select the spread option. Should also enable the ASK LINE on the chart. Press F8 on the keyboard or follow the instructions about the COLOR SCHEME above. Once you're at the settings part of things - go to the COMMON tab and enable the ask line.
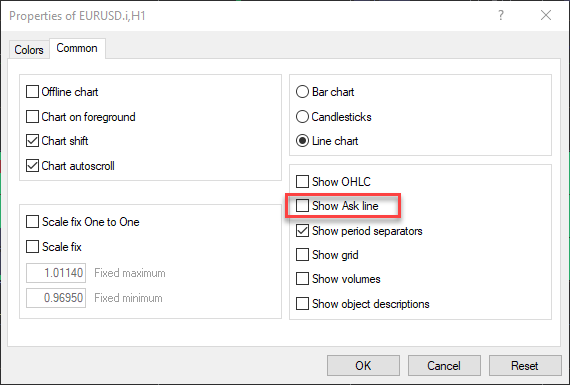
This will show you the ASK LINE on the chart. Normally you only see one line for where price currently is. There's basically a TOP and BOTTOM price - your ASK and BID. The tricky part is this. Let's say you make open a buy. The entry comes in at the TOP line and in order for it to go in profit - the BOTTOM LINE needs to go higher than the entry point.
Conversely, if you open a SELL then it takes the entry at the bottom line and the top line has to cross the entry point and go lower in order for you to go in profit. When you see it on the chart you'll know.
The hard part is this. If you have a TP/SL - once the bid line (the one that's normally there) crosses it - that's it for the entry. I may be wrong here - so correct me if I am - or do the checks on the chart yourself.
Below you'll see the spread difference on two pairs. It will be easier to trade with brokers that offer lower spreads and on pairs that have lower spreads.
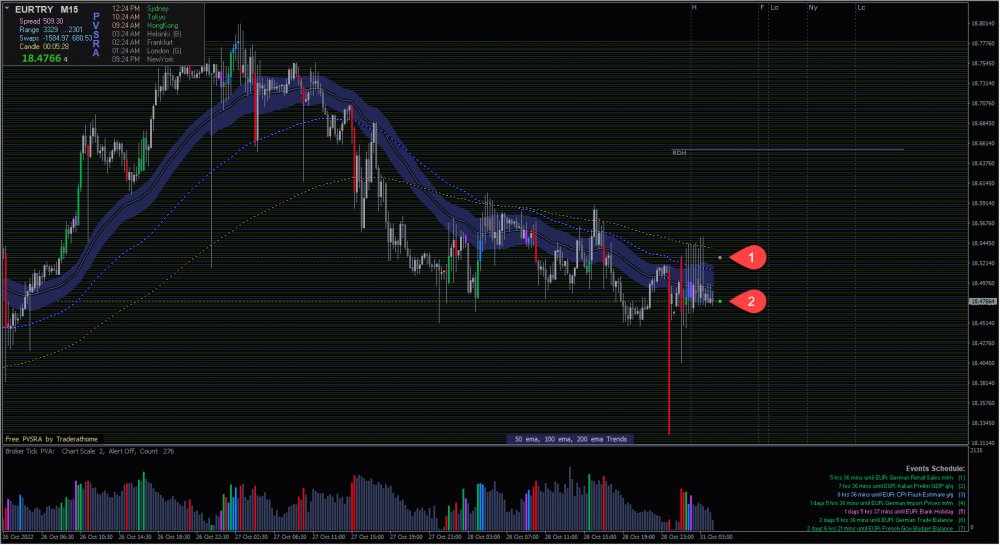
Above you can see that the spread on the EURTRY pair is very wide in comparison to below.
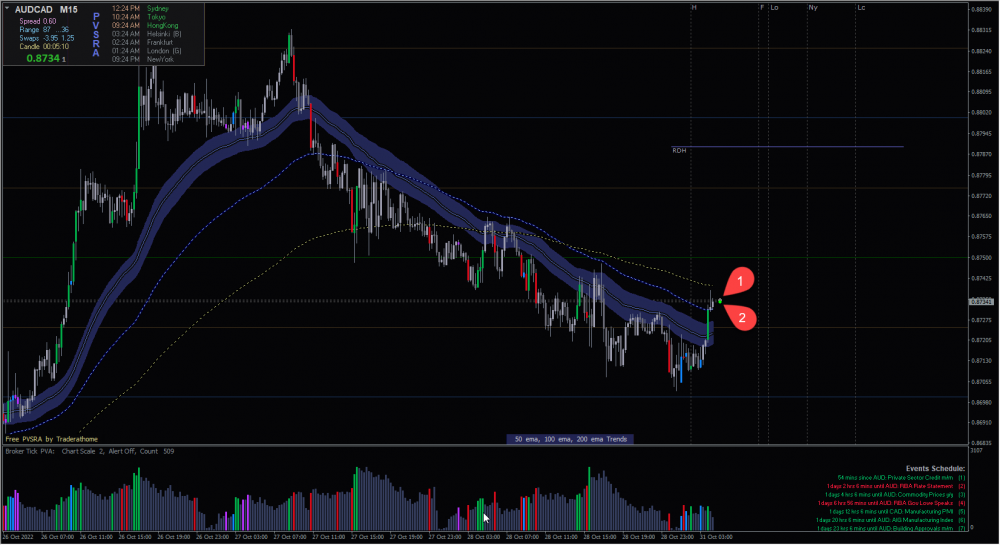
Spreads on mainstream pairs are usually tighter than on exotics - other pairs that are not mainstream. AUDCAD - Australian Dollar vs Canadian Dollar is more mainstream than EURTRY - Euro vs Turkish Lira. To put it in perspective - AUDCAD has a spread of about 4 points (0.4 pips) while the EURTRY has a spread of about 5,000 points (500 pips).
End Of Day Spread / News Spread
Usually at the end of each day - 4PM or 5PM Jamaica time depending on DST - you'll find that the spreads widen to some ridiculous amounts. It's part of the design and may take out your stops. What happens is - brokers are doing their checks and balances and want to discourage retail traders from taking an entry. Spreads get wide and you end up with swap. We'll get to that next.
Swap
Swap is the other cost of doing business. This is basically the difference in the cost of the pairs and the value of the position. While I don't recall the exact amounts, there are indicators you can use to help figure out which pairs/position gives you what kind of swap. If you hold a position into the next trading session (into the next day) then you will accumulate swap. This will come in the form of a negative or positive amount added to your position based on the size of your position. Again - don't quote me on this - check with your broker by using a tool on the charts - but let's use a pair as an example. GBPUSD has the GBP being valued higher than USD typically. If you open a BUY on GBPUSD and it stays over into the next day, you'll pay -$0.30 for ever 0.01 lot you have open. If you had a SELL however, you would earn +$0.07 for every 0.01 lot you have open. Again - that's just an example. Each broker will have a different value for their pairs, and the +/- swap will differ from broker to broker and pair to pair. Check using an indicator to be sure.
Gaps & Slippage
GAPS
This is something that happens from time to time - and especially during news. Remember the OHLC? You can click to go back to up further up. The close of one candle should be the open of another - with no space between the close of one and the open of another. If there is high market volatility - like during high impact news - you may have cases where the open of a candle has a space between the close of the previous one.
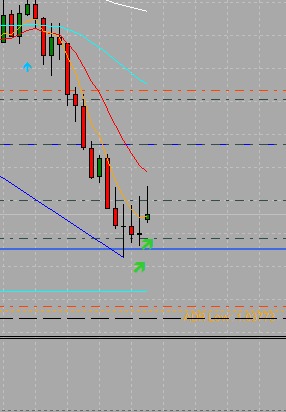
Note that the newly forming candle has a space between it and the previous candle - as opposed to all of the other candles. This shouldn't be the case - but it does happen from time to time. Shady brokers will do this a lot to push price over your orders - so you'll have cases where your order is not picked up.
SLIPPAGE
This is the other thing that happens - and it occurs more often than you'd think. It's not limited to shady brokers - it can happen on good rated ones as well. You may have cases where news pushes price very quickly beyond your entry, SL or TP before it gets filled. In the case of a TP - it's great when you get filled beyond your level. That doesn't happen very often, but it does happen...sometimes.
Most likely you'll have a case where price jumps over your entry (pending/limit/stop order) and gives you a worse entry - or no entry at all. And what happens more often than not is your SL gets filled at a far worse price level. I'd like to show that on a chart.
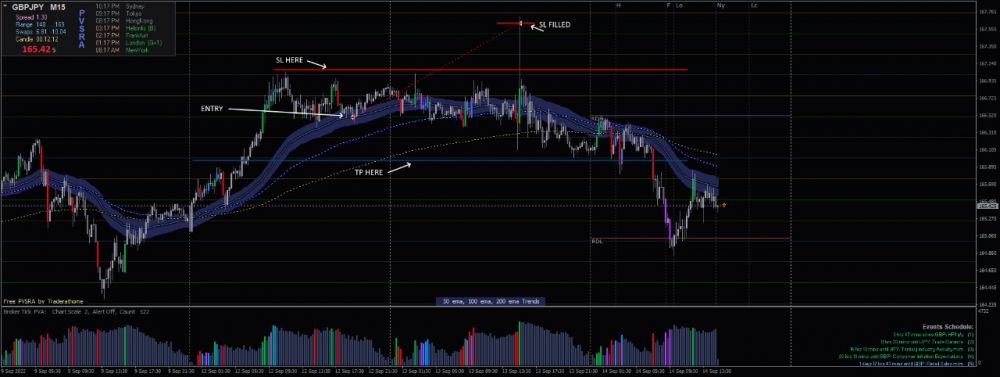
Here my SL was filled around 60 pips (600 points/ticks) above the SL level. You can imagine what that felt like. Unpleasant is not the word.
In Closing
These are things that you'll eventually get accustomed to. Based on your broker, you'll figure when are better times to trade and whether or not you should avoid certain types of news - or news altogether. While I'm hopeful that some of the slippage and gap issues will never be experienced by you - it'll probably happen at least once. Maybe more if you have a bad broker.
Sometimes a good broker may just have a bad day. One of them that I personally avoid was due to a major difference in their chart versus other brokers. This happened once - but it was scary. And while MANY persons said they never had that issue - or they never saw it again - it's enough for me to stay away. i won't tell you explicitly not to use a particular broker, but I will tell you the ones I've used and recommend.
Outlook & Strategy
That's out of the way. Let's move forward a bit. We're in 2022. I've (mostly) streamlined processes and will be discussing how I got here. I'm going to try to summarize at first and then get into detail later on. But let me do this beforehand.
I've spoken against TradersWay (TW) before - repeatedly - but you can have issues with ANY broker. What you should do is find whichever one works for you. I've had a bad experience with them - that doesn't mean you will. There are persons that have NEVER had a problem with them. I guess I was just unfortunate. So here we go.
TRADING METHODS - Summary
There are two specific methods that I've bastardized and combined to get what I think works. This is after years of trying lots of things - from being manual to automated - back to manual - etc.
- BTMM
- PVSRA
You can look them up and find information. IMO - PVSRA is a refined version of BTMM with specific rules that will help you to earn. BTMM took a more holistic approach which works for some - but not for others. Using things learned in both will help you to push forward.
HISTORY
Here's some trading history for you.
2019 - started out with the broker HotForex.
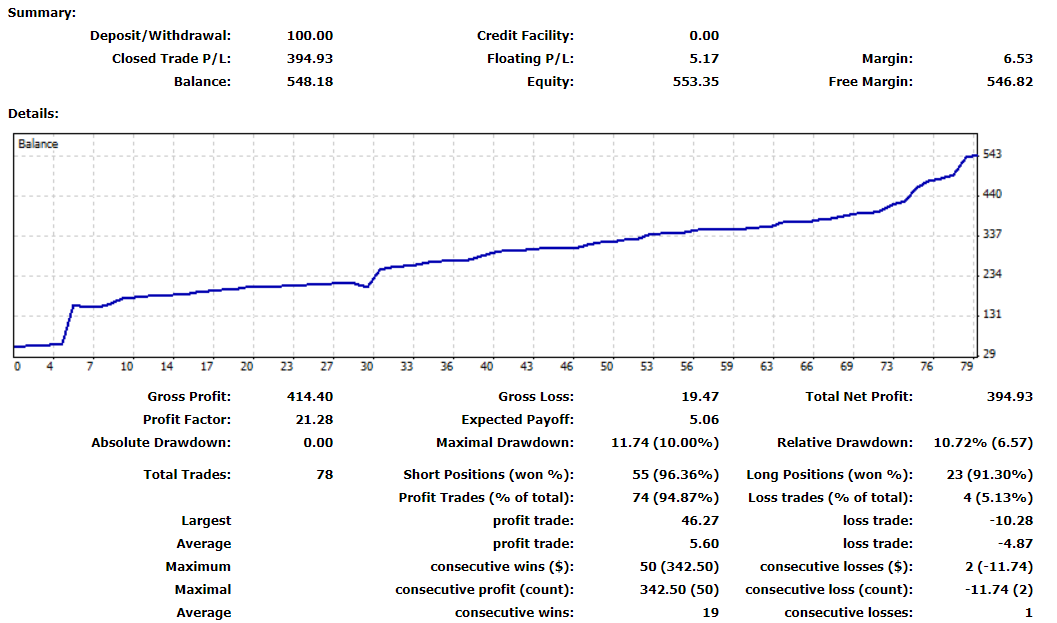
Then I moved from HotForex to ICMarkets
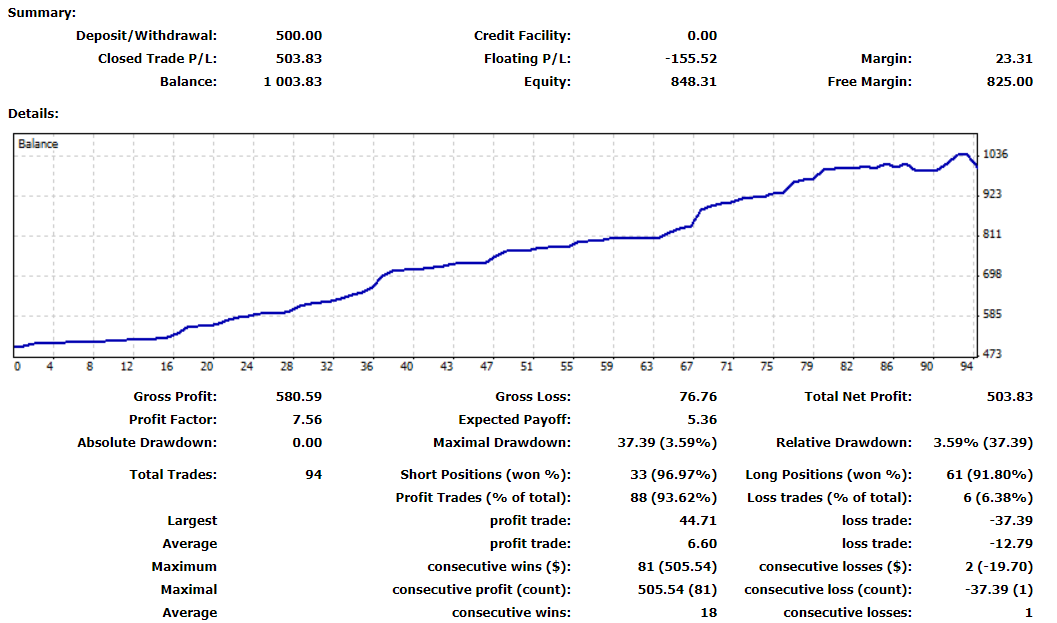
And then my father got sick and died. And that was it for my account. Heavy over-leveraging and attempts to make fast money didn't work out. Trading is a process. It takes time to get things right. I left it alone and really just started back. There's been a lot of ups and downs, but I've not actually started with a large enough account to get anything done. I've had losses through the year trying to refine and get something that works with my 9-5 schedule. I'm getting on to it.
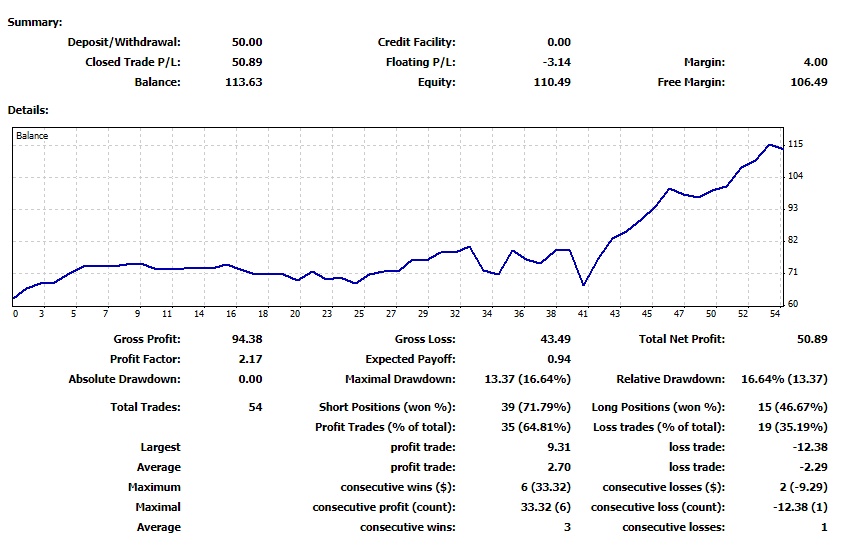
This is something which is doable. I'll get into more detail when I can. The last image above is at 2022-10-06. It's hard for me to balance the daily job and trading - but it may be easier for you. My job isn't your typical 9-5 so I'm free from physical and paperwork late at nights. That means I miss market moves and other things.
What I've done since October is open a challenge account which gives a high value demo to trade. Once you prove your worth there, you're given a live account where there is a profit split. You can look up companies like FTMO and MFF - or just search for Forex Prop Firms to see what the options are.
But now that the sob story is out of the way. Let's get into what you wanted. The reason you're here.
Using The Trading Methods
Now this section is going to take some time to edit and get right. I'm going to try to summarize it as much as possible for now - and then I'll expand as I can. I expect that you getting here - you've looked through the videos/training mentioned before - or you have some knowledge about trading overall and are just here for the juicy bits.
My methodology takes two things into consideration - and it's not as "weird" as lunar cycle trading. Again - not to knock what people use (and are profitable with) - but it just doesn't seem logical to me. I mean - Ichimoku Cloud trading is another thing that works - but it was far too complex for me to grasp.
Let's see if it can make sense to you. As I said - I'll expand as I have the time.
Indicators - Tools - EAs
This section will have links to tools that I recommend using. It will have a version of PVSRA and most of the tools used to analyze and enter trades. Any tool that I've paid for will not be listed due to copyright and such.
https://u.pcloud.link/publink/show?code=kZ4mHuVZwrcYclCR7tfY6ugB4bDyKHRQ8Ei7
Use the link above to download whatever tools are needed.
You'll note that there is a CLEAN-2.TPL file there. I've noticed that PVSRA - while good - does not play well with other tools, indicators or EAs on the chart. Either it crashes MT4 or you need a REALLY fast PC to let it play well. So I made the CLEAN-2.TPL file which is basically the same MAs as PVSRA but no zones or anything. It will allow you to use the Position Size Calculator EA to help with taking your trades. Just ensure that your DEFAULT template is not set to PVSRA - and it will load fine.
- If you load PVSRA - don't load another template and try to load an EA/indicator. It may crash.
- Close the chart entirely and open a new one then load the CLEAN-2.TPL - then load your indicator/EA.
BTMM & PVSRA
These are two trading methods that I've found compliment each other very well. Let me give the summary.
BTMM
The BTMM (Beat The Market Maker) method basically says there's a dark side to the trading markets. There are persons on the other end of your trades that are out to get you. Well - not YOU specifically - but all retail traders. The vast majority of traders place their orders and stop loss in the same ranges. The MMs (Market Makers) push price to pick up these orders and have you in DD (drawdown - negative balance) or hit your SL (stop loss) to take you out.
BTMM is a reversal strategy that identifies tops/bottoms based on patterns and trades away from the reversal formation.
PVSRA
From what I've seen - PVSRA (Price, Volume, Support, Resistance, Analysis) is related to BTMM, but focuses more on the trend than the reversal. The concept is based on PATIENCE where you wait for the setup. There are 3 MAs (moving averages) that are used, and price needs to break the primary (50 EMA) and retrace to it before you enter. This essentially identifies the top/bottom/peak and trades away in line with what would be an established trend.
Putting Them Together
The best thing to do is combine the two. But the HARDEST part about all of it? Patience.
Hindsight & Homework
Any idiot can look on a past chart and show you all the best entries and exits. Identifying what YOU did on the chart - what you did right and what you did wrong - will help you to identify when these things are setting up. It can then help make you a better trader overall. Homework involves either taking screenshots of the chart to review - or taking the time and the session end or on the weekend to look back at what you did. Analyzing before entry is critical. You may not get "the perfect entry" when you spend time analyzing - but you'll be more sure of the direction and WHY you are entering. Keeping a journal helps for some.
Trade What You See
This is something that I can't stress enough. Examples will be used for the previous week on USDCHF because it gives a very clear picture of where price is and went. I'll be showing the mistake I made as well - in the hopes that you don't do the same. Emphasizing that you should always trade what you see - not what you feel or think. Doing so will save you lots of grief.
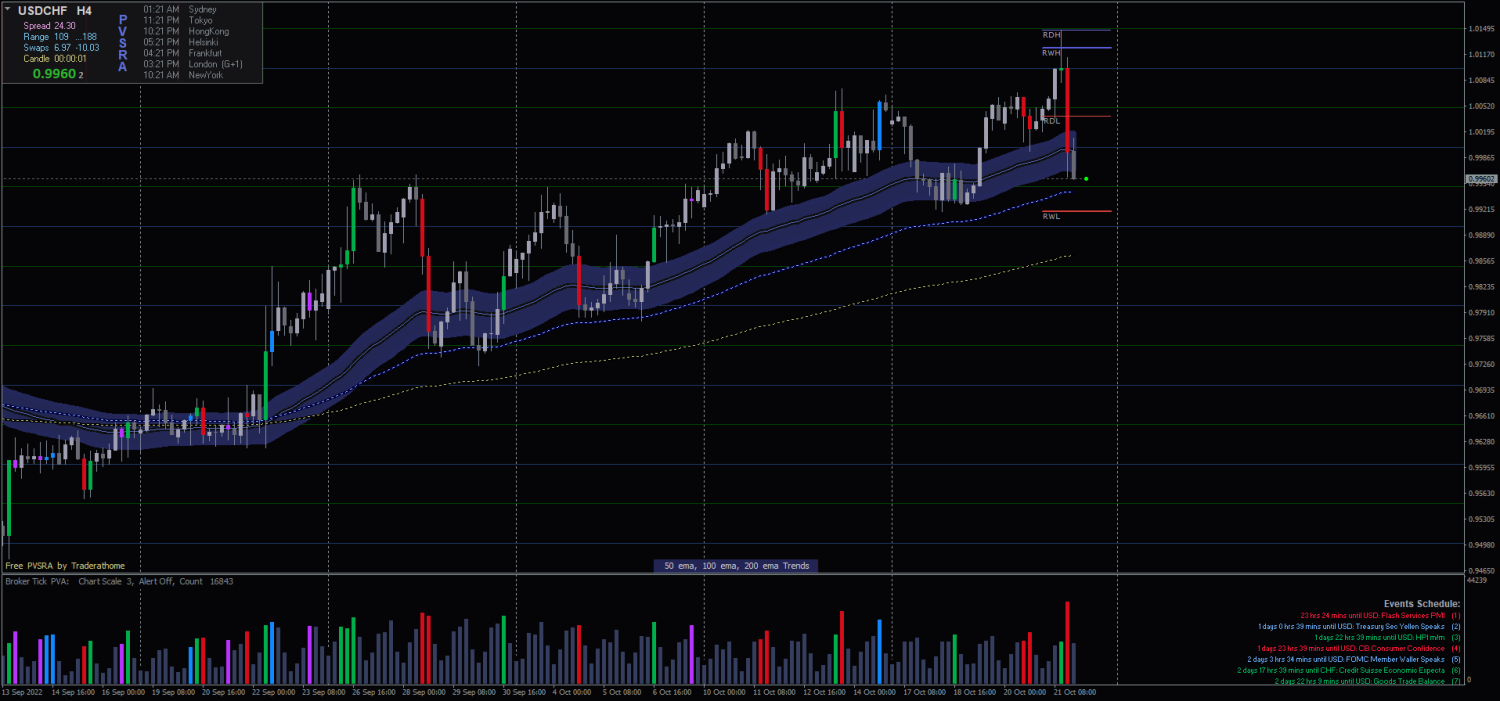
Here you can see the USDCHF pair. This is the H4 timeframe so each period separator is a week. You can obviously see that each week the price has been going up.
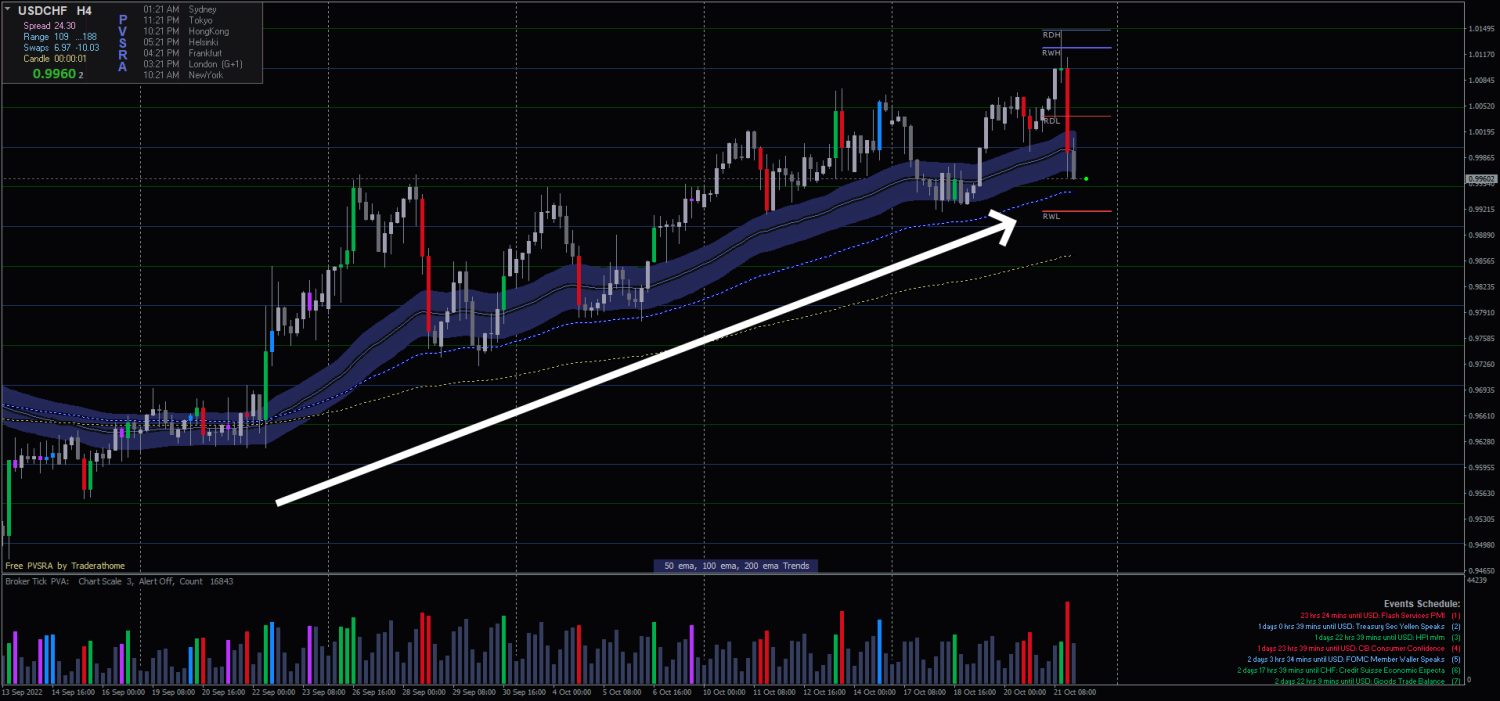
How do you enter on this? Well - as I said - hindsight is 20/20. You can tell various areas where you could find optimal entries.
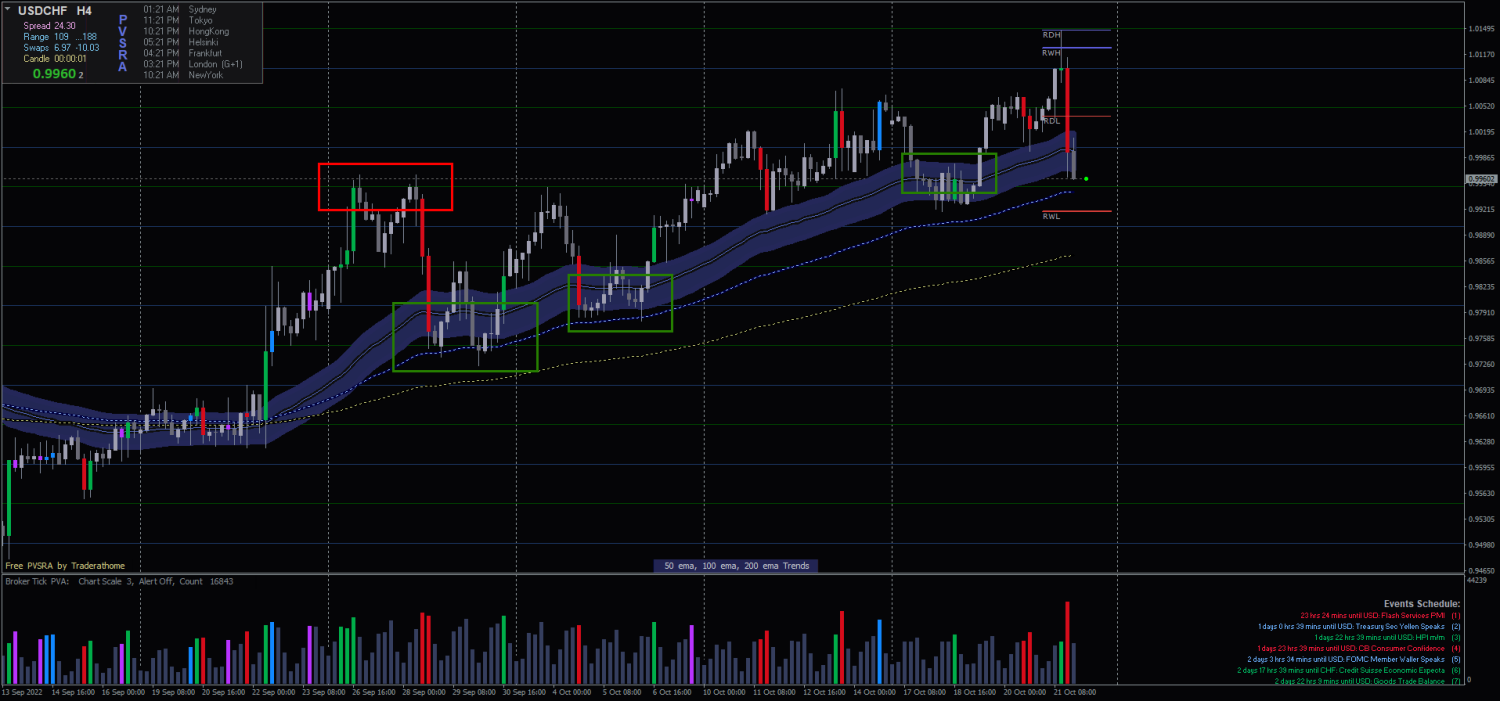
Buy entry areas in GREEN while sell entry areas in RED.
Why enter the sell on the up trend? Because it made a double top at a zone. There are pins there which show an obvious rejection of the zone. And you're trading it back towards the MA. While it's doable - it's not recommended. Better to sit and wait or check another pair.
Let's look at the first sell area where the double top is. And let's move to the M15 chart to zoom in basically.
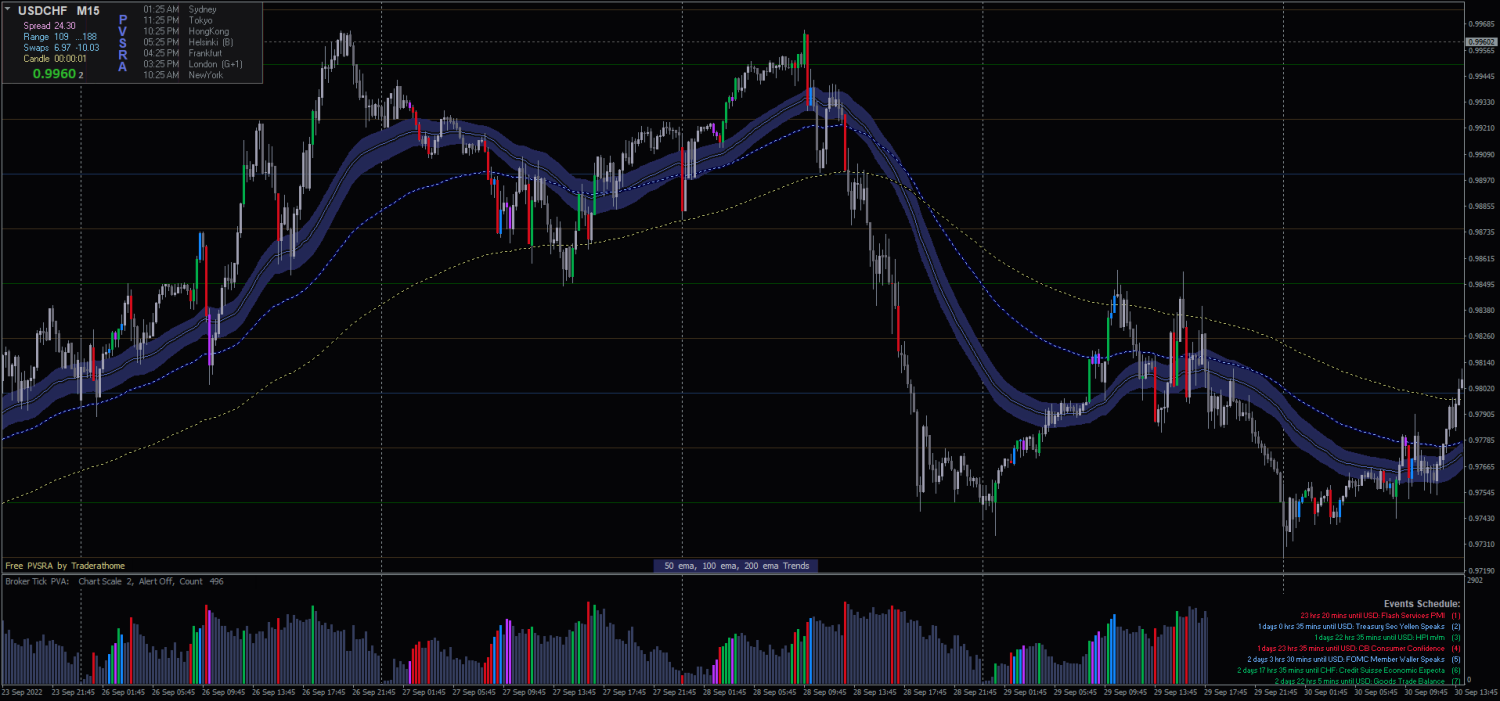
Don't see it? Let me help you out.
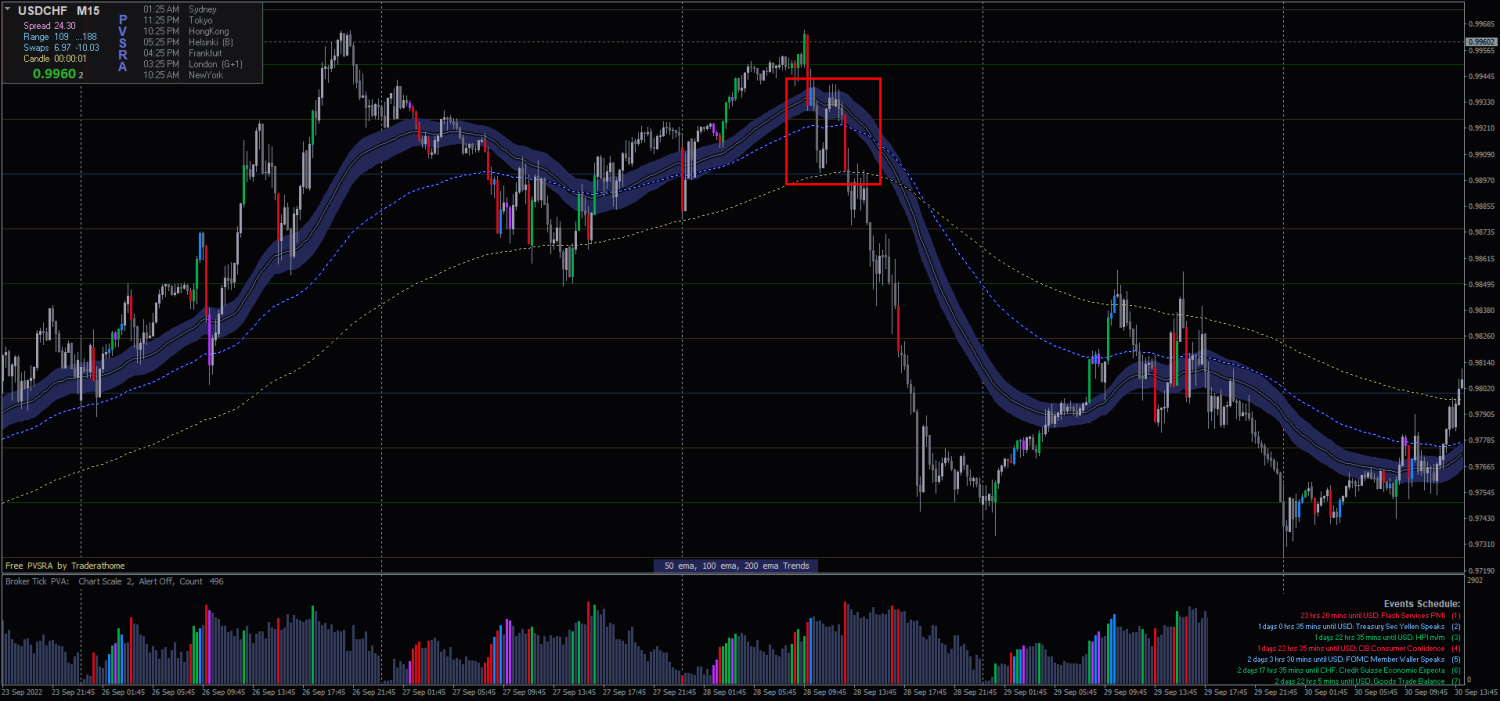
There's your entry - but let's explain it.
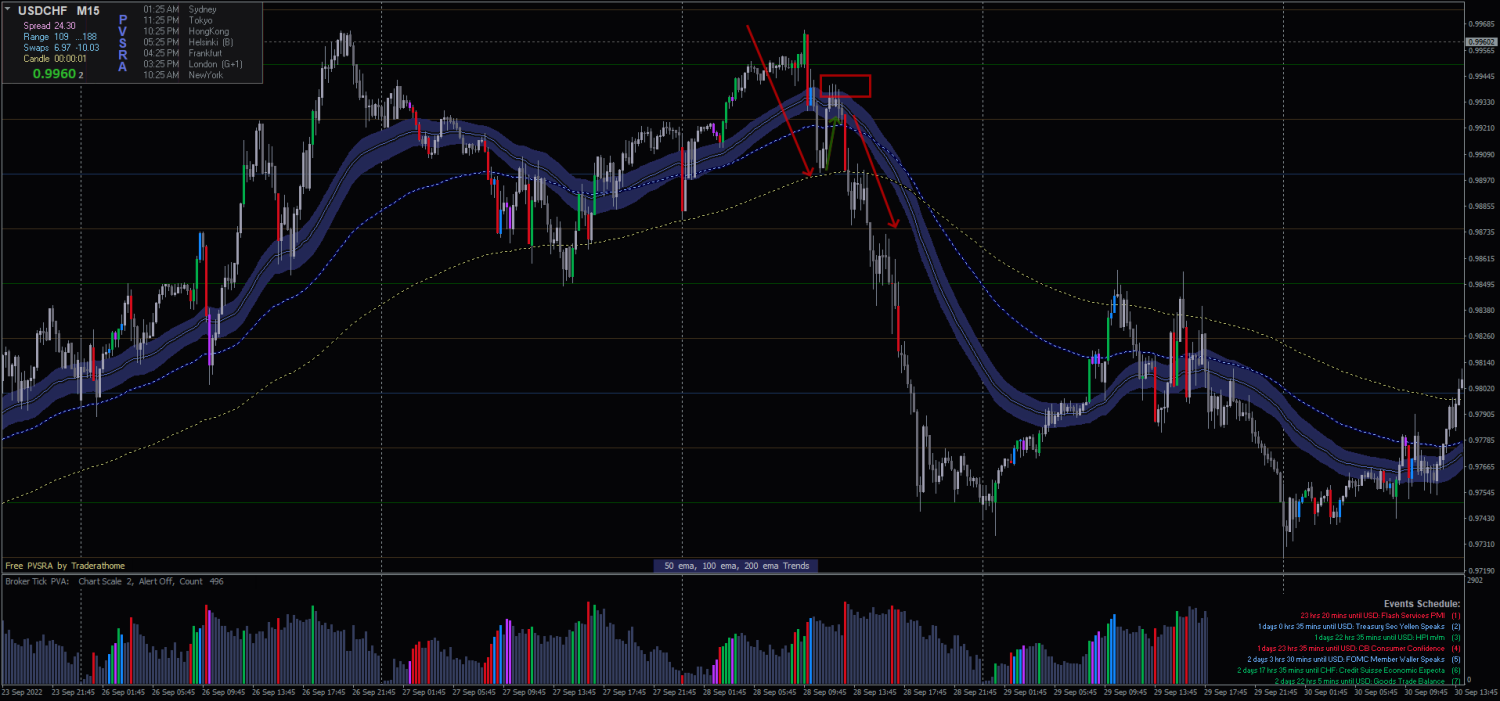
Price made a double top on the H4. You zoom in on the M15 to check it out. Price broke the 50EMA and went down to the 200EMA. Bounced back up but did not break the high. Your entry is off any of the candles that made pins to the high. SL is above the high. Your TP is anywhere between where it is and back to the MA on the H4 timeframe. Or H1 if you want to look there as well. To follow PVSRA - your TP is actually a minimum of 20 pips (200 points).
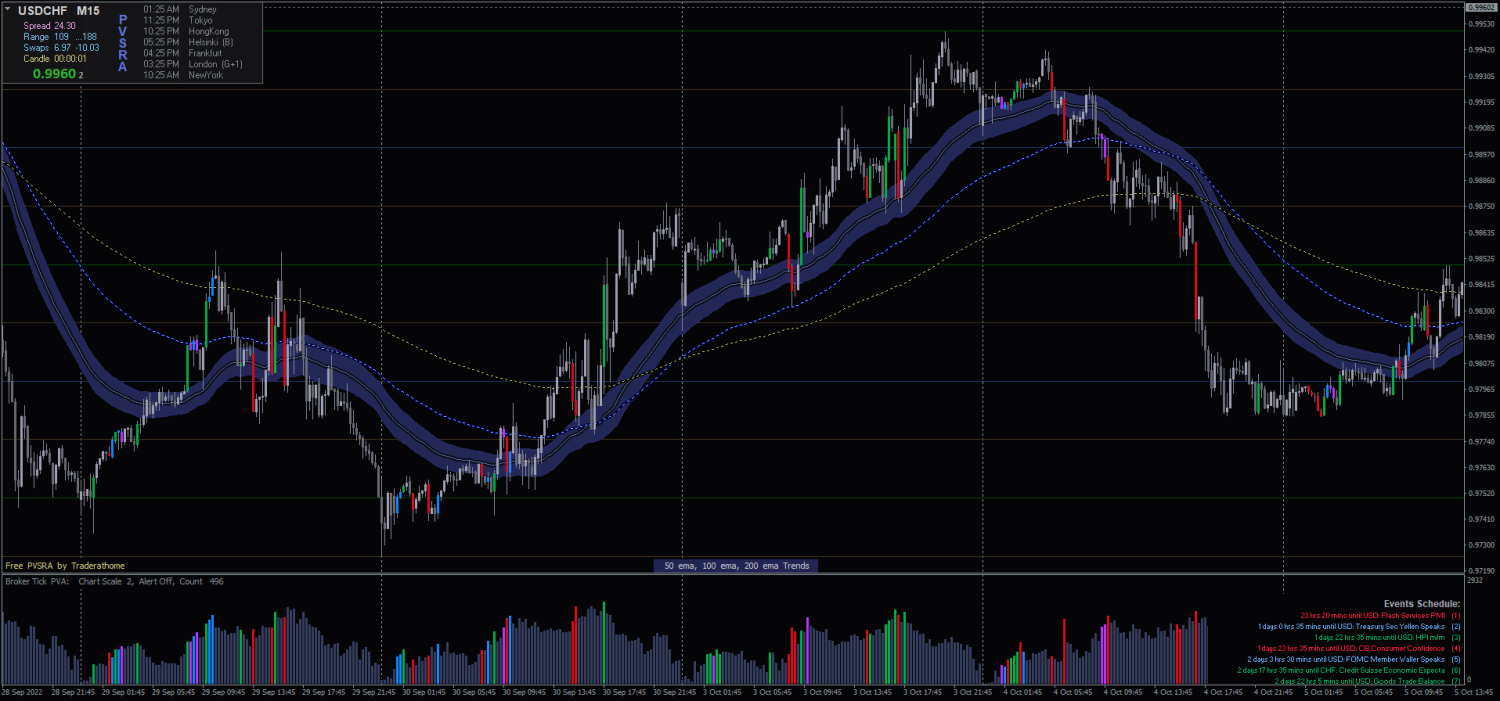
Price then moved away from the double top (M) formation and back to the MA. It consolidated a bit and then moved up. Broke the 50EMA again and started to climb. Where do you enter?
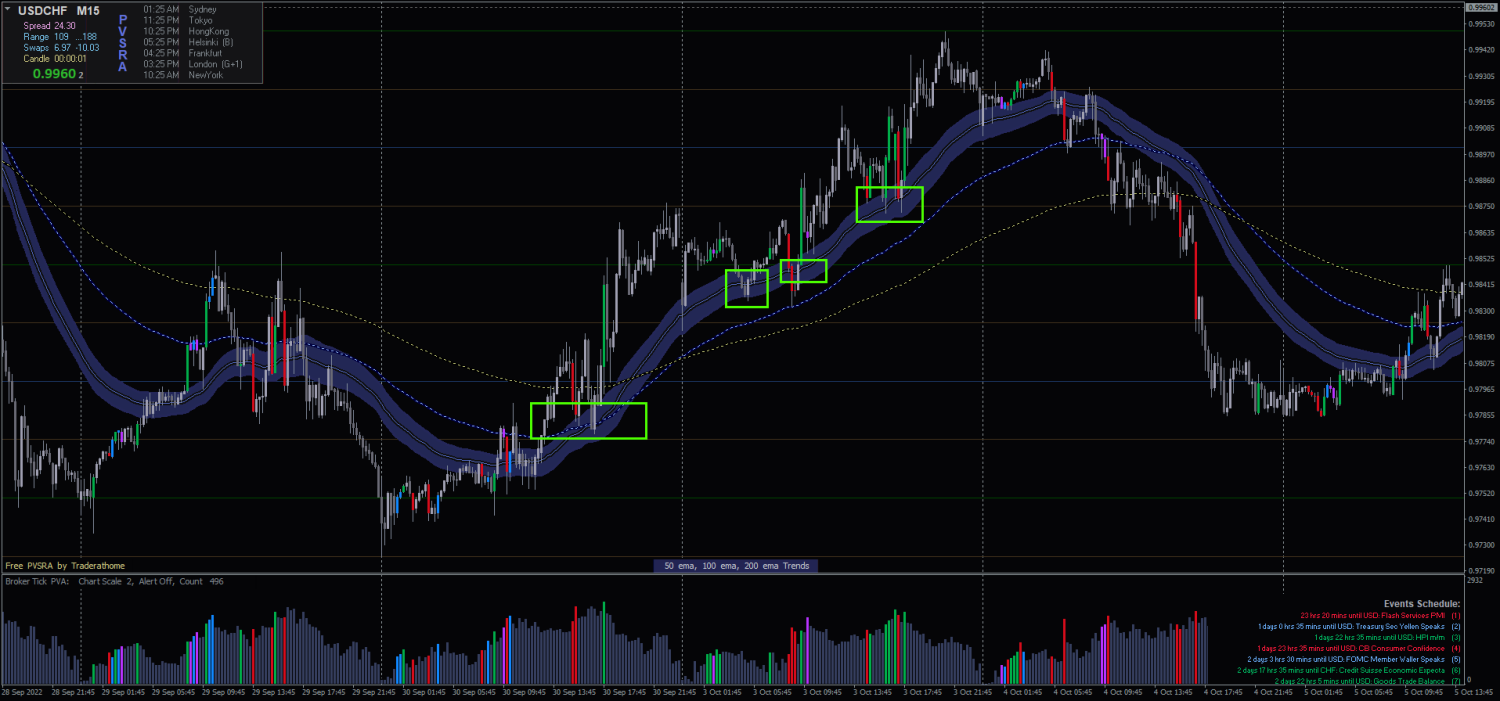
As I've said. Hindsight is 20/20. PATIENCE is the hard part. When you do the homework and look back on the charts - you can see the setups in real-time. Do the work. Check for the entries. BE PATIENT!!!! I can't stress that enough. And you'll eventually get the hang of it. Once you're sure of your strategy - move to live.